Pipeline Visibility: What Fivetran Looks Like Inside Collate
Introduction
Fivetran started as a focused tool for getting data from point A to point B. Feed it a source, give it a destination, let it run. That simplicity was the product. Over the years, the product evolved to satisfy an increasing number of use cases and became considerably more robust: Fivetran acquired SQL Mesh, merged with dbt, and dbt had already acquired SDF Labs. What began as an extract-load tool is now more of a full data transformation platform. How that consolidation plays out is a question the next few years will answer. What's relevant right now is that Fivetran is deeply embedded in many data pipelines, and Collate now catalogs them.
A companion video is available here, and the documentation is available here.
Setting Up the Connector
Fivetran lives under pipeline services in Collate rather than under databases. It's not a data store; it's a mover, so there's no host configuration to wrestle with in the standard SaaS setup, and no schema mapping to define. The connection requires an API key and its corresponding secret, both generated from within Fivetran. Enter them, run the test, and the connection is done.
One default worth knowing about: Collate excludes Fivetran's internal metadata pipeline from ingestion by default. Fivetran routes its own logging data to a user-defined destination rather than hosting it internally, so the metadata pipeline appears as a separate entry in Fivetran alongside your actual data pipelines. Excluding it keeps the catalog focused on the pipelines that matter. You can include it if you want full visibility into Fivetran's internal operations, but for most teams, leaving it out is the cleaner starting point. The process looks like this:
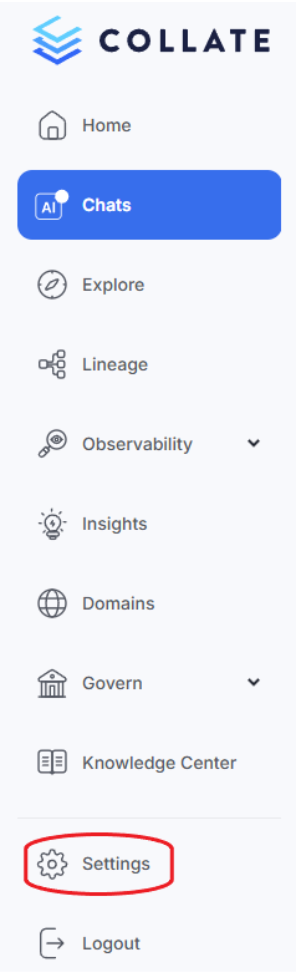
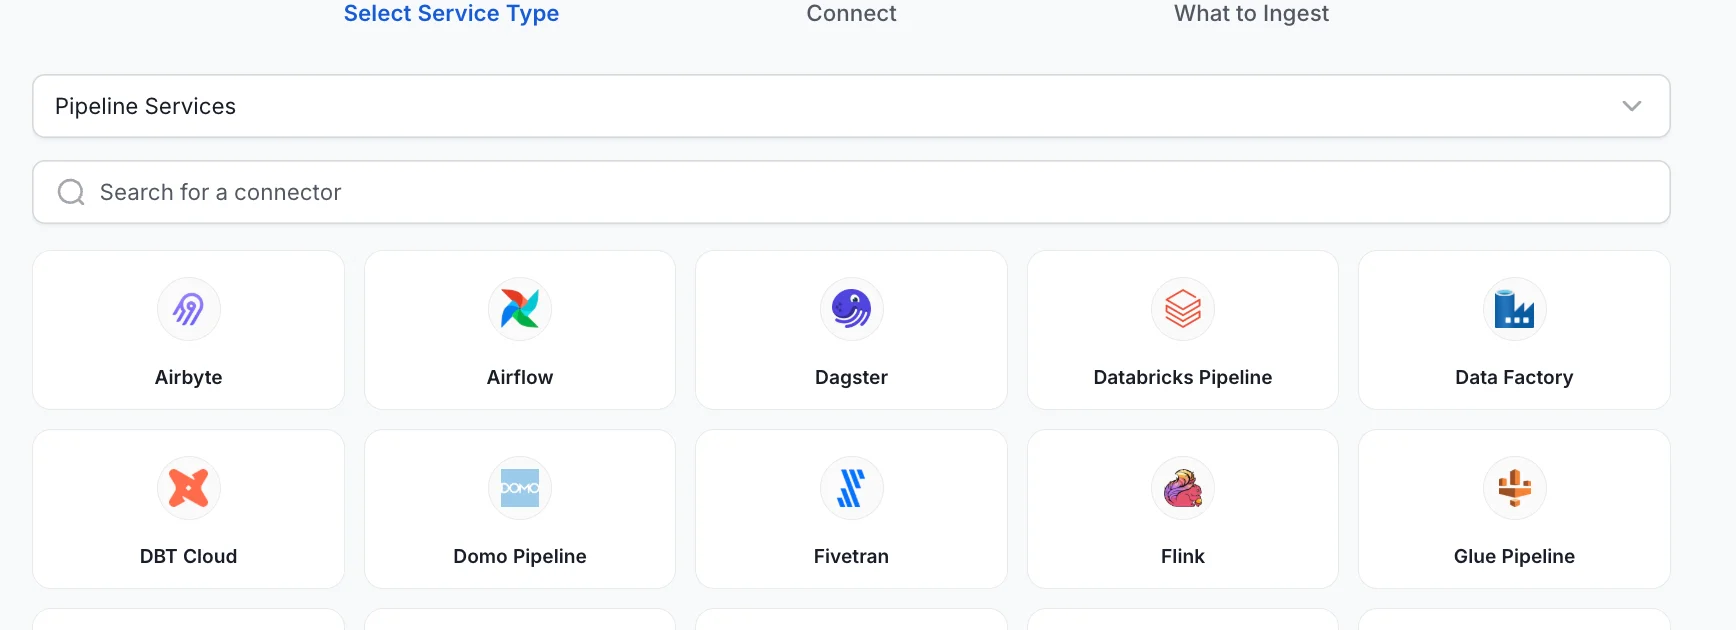
1. Navigate to Settings: Begin by accessing the services section in Collate's settings.
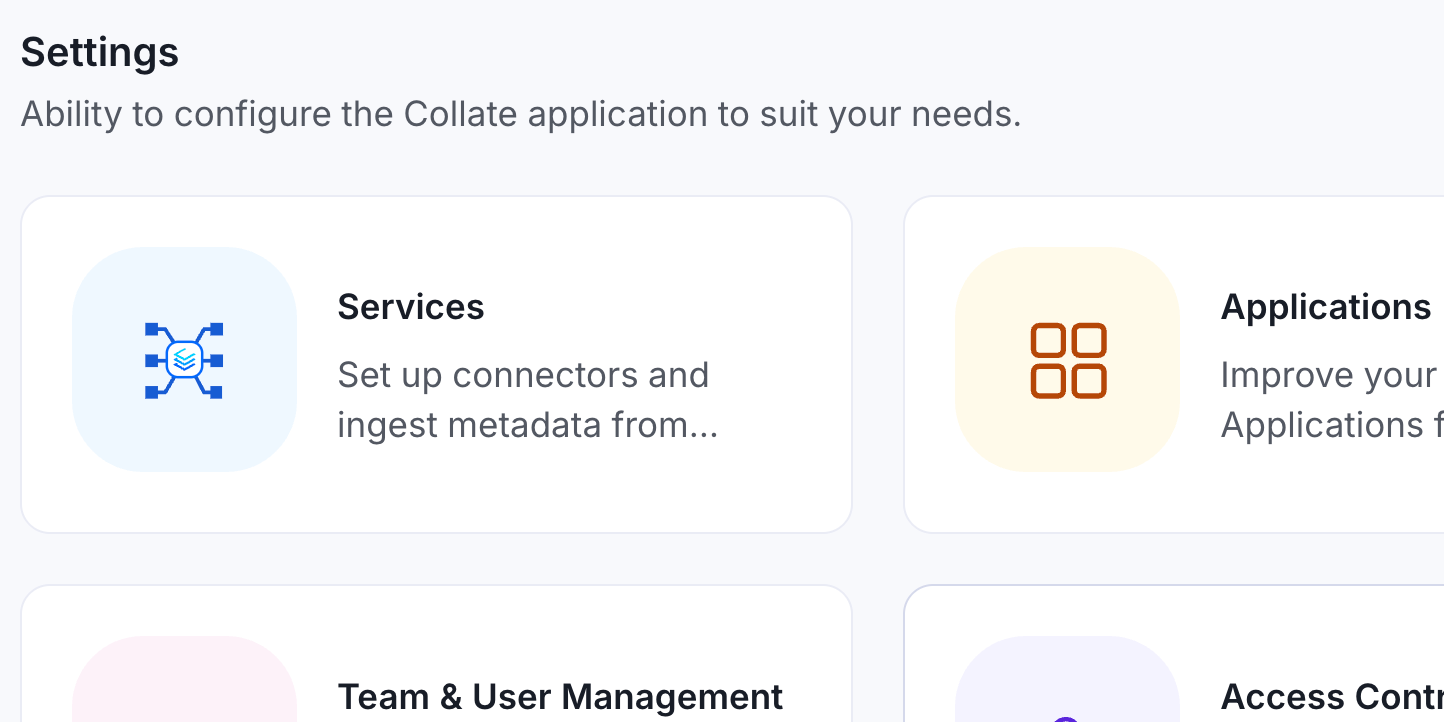
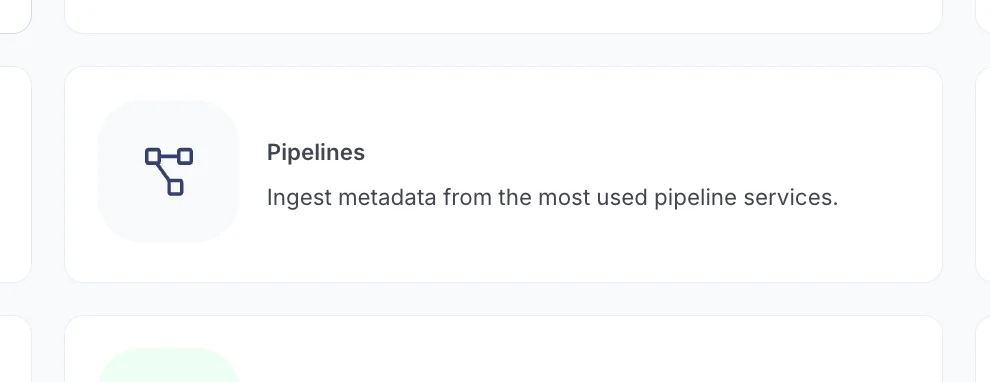
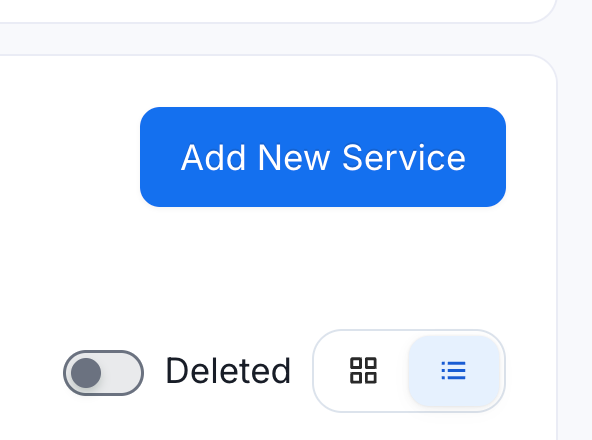
2. Add New Pipeline Service: Select “Services”, then “Pipelines”, then "Add New Service" and search for Fivetran in the service list.
What Gets Captured
Once the metadata agent runs, Collate surfaces each Fivetran pipeline as a cataloged asset. A Postgres-to-Snowflake pipeline, for example, shows up with the full DAG structure of its execution: extract, process, load. Each stage is captured, including failures. If a pipeline run fails because credentials weren't configured correctly, that event is recorded in Collate alongside the subsequent successful runs. Duration is captured as well, so you can see that a particular processing step took 23 seconds without having to go back into Fivetran to find it, for example.
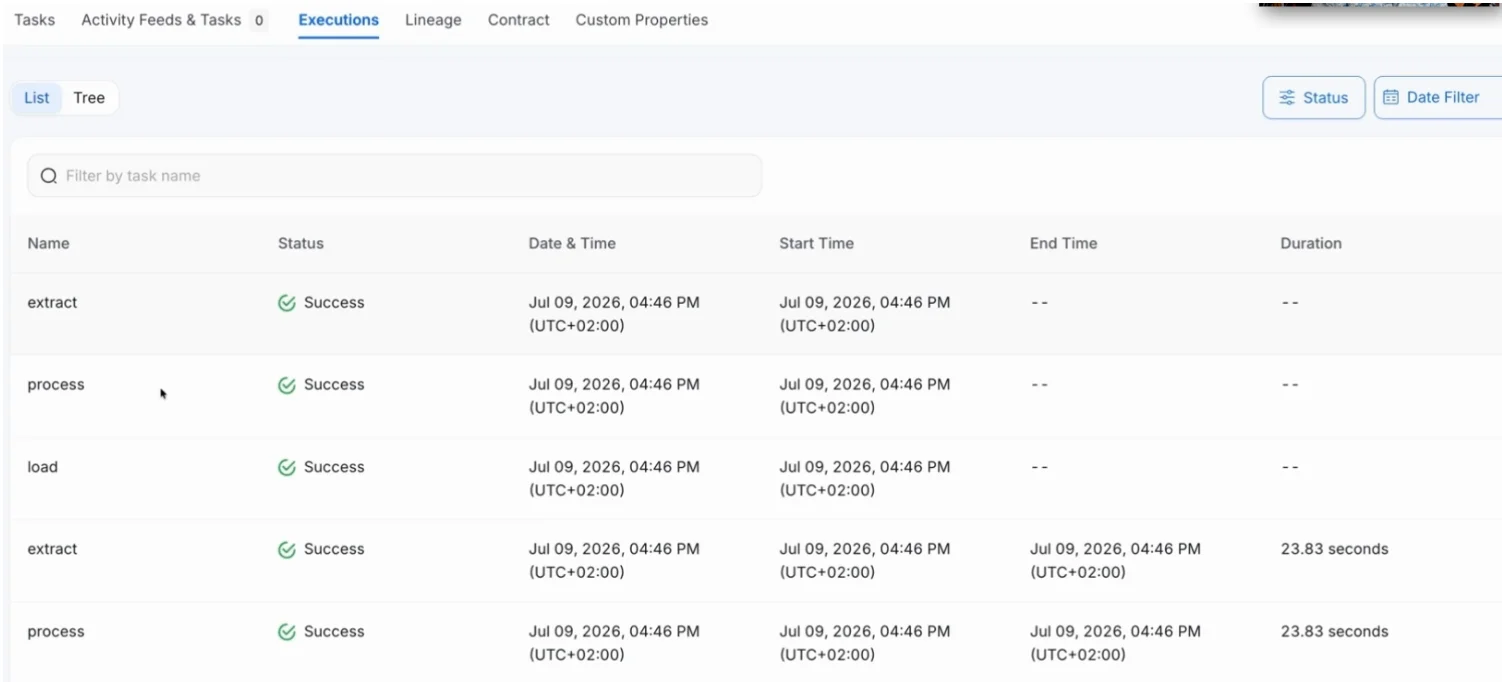
The execution log view shows this history in both a flat list and a tree view, giving you the option to look at individual task-level events or the overall run structure, depending on what you're trying to understand.
Lineage at the Table and Column Level
The most useful thing Collate captures from a Fivetran pipeline isn't necessarily the execution metadata; it's the lineage. From any destination table in Snowflake that a Fivetran pipeline populated, you can trace back through the pipeline service to the source table in Postgres. That connection is visible at both the table and column levels.
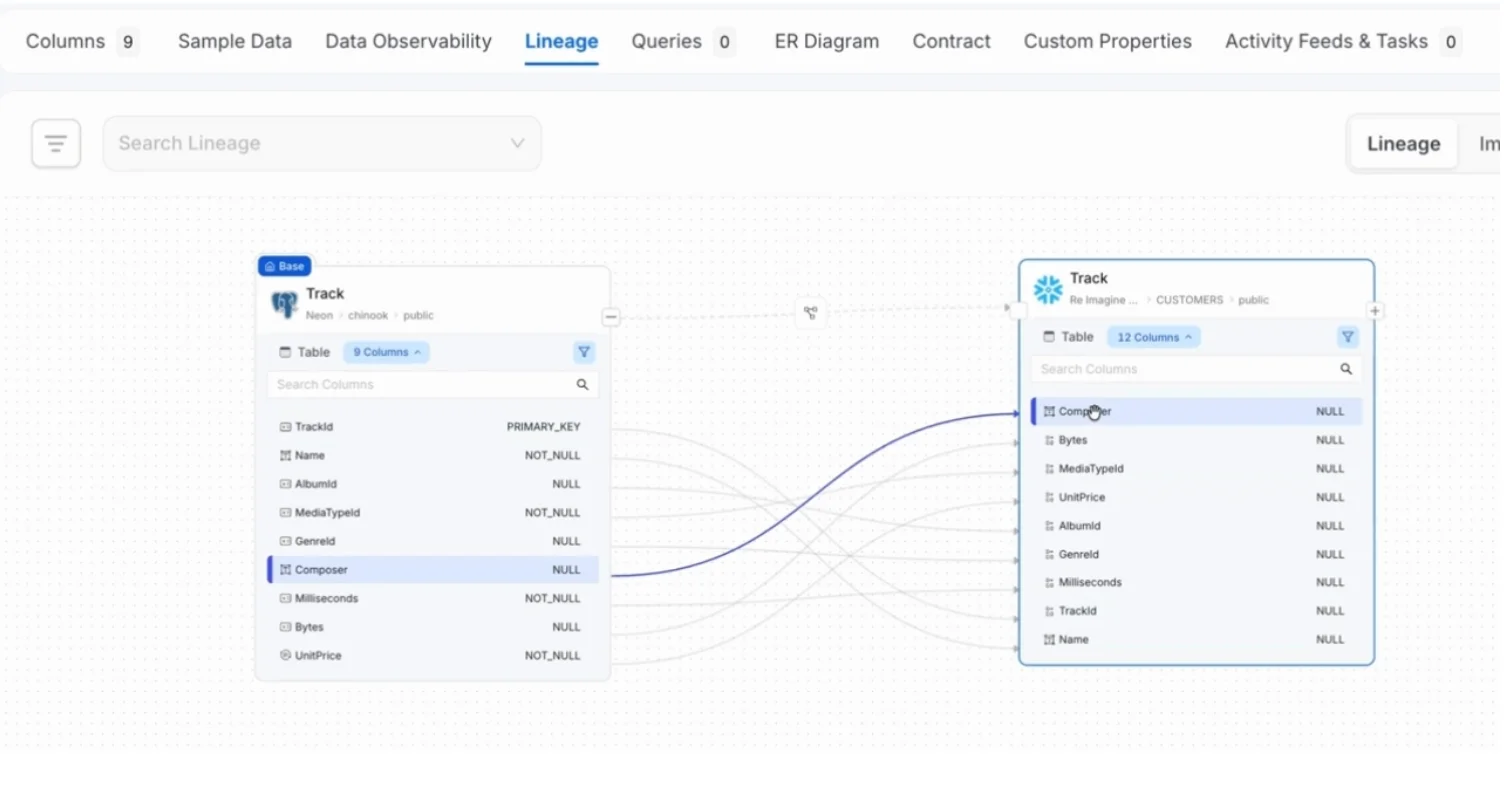
The column-level view reveals something that table-level lineage doesn’t reflect: column order doesn't always match between source and destination. Fivetran adds its own metadata columns to destination tables, so the naive assumption that column one in the source maps to column one in the destination is wrong. With column-level lineage in Collate, you follow the actual mapping lines rather than guessing by position. For anyone auditing data transformations or trying to trace a specific field through a pipeline, this distinction matters.
The lineage view also scales up to the service level, where you can see the full picture of what's flowing into and out of the Fivetran service across all its pipelines. That higher-level view is useful when you're trying to understand the overall shape of your pipeline architecture rather than debugging a specific table.
Pipeline Observability
Beyond lineage and execution history, Collate adds a pipeline observability layer that tracks pipeline performance trends over time. Success and failure rates for individual pipelines are visualized over time windows, so you can see at a glance whether a daily Postgres-to-Snowflake sync has been reliable or has intermittently failed. This view spans pipeline services, including Fivetran, dbt, Airflow, and others, in a single place.
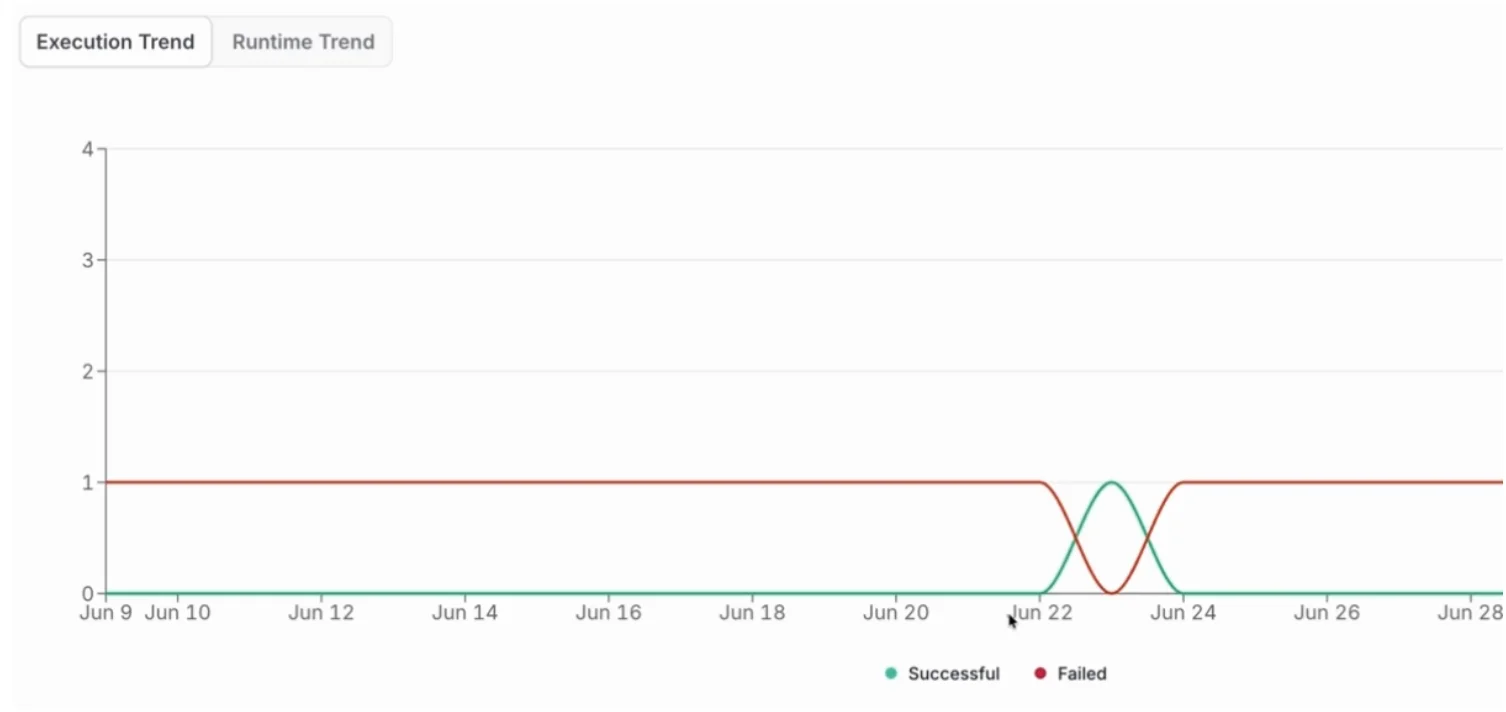
The practical value here is alerting. If a Fivetran pipeline feeding a Snowflake destination table starts failing, the people who depend on that table should be notified before they notice the data is stale. Collate sits above the pipeline layer and can trigger notifications when things go wrong, connecting pipeline health to the data assets downstream consumers actually care about.
Governing Pipeline Assets
Once a Fivetran pipeline is in the catalog, it gets the same governance treatment as any other data asset. You can assign it to a domain, set an owner, apply a tier to indicate its business criticality, and add tags or glossary terms. The pipeline asset also links directly to Fivetran, so from inside Collate, you can navigate to the pipeline configuration to make changes.
Pipeline failures have downstream consequences that often aren't visible to the people affected by them. A data analyst looking at a Snowflake table doesn't necessarily know that the table is populated by a Fivetran pipeline, or who owns that pipeline, or whether it ran last night. Having the pipeline cataloged alongside the destination table closes that gap. Ownership, criticality, and status all live in the same place as the data itself.
Conclusion
Collate is past 120 connectors at this point, and the pattern is consistent: each addition extends your coverage, brings more of the data stack into a single governance view, and reduces the number of places a team has to look when something breaks or changes unexpectedly.
To explore further, consider the Collate Free Tier for managed OpenMetadata or the Product Sandbox with demo data.
Fashion Retailer Mango’s Data Journey with Collate
Read the case study

Sign up to receive updates for Collate services, events, and products.
Share this article


Ready for trusted intelligence?
See how Collate helps teams work smarter with trusted data