Bringing Apache Superset into Collate: Open Source BI Meets Data Governance
Introduction
Apache Superset has earned its reputation as the gold standard for open-source business intelligence tools. For organizations looking to avoid vendor lock-in with Power BI or Tableau, Superset offers enterprise-grade dashboarding capabilities without the enterprise price tag. But like any BI tool, Superset dashboards need governance, documentation, and context. That's where integrating Superset with Collate comes in.
In a recent demonstration, Collate Solutions Engineer Aydin Geeringh walked through this integration, showing how teams can bring their Superset assets into a unified governance framework while maintaining the flexibility analysts expect from their dashboarding tools.
Why Apache Superset?
Before diving into the integration, it's worth understanding Superset's position in the BI landscape. Everyone starts with grand ideas of "I can do that myself" when it comes to analytics. Apache Superset enables exactly that, providing professional-grade dashboarding without licensing costs. It's the natural first choice for cost-conscious organizations that still need sophisticated visualization and analysis capabilities.
The tool handles everything you'd expect from enterprise BI: SQL-based data exploration, interactive dashboards, rich visualizations, and data modeling. The fact that it's open source means teams can customize and extend it to fit their specific needs.
Setting Up the Connection
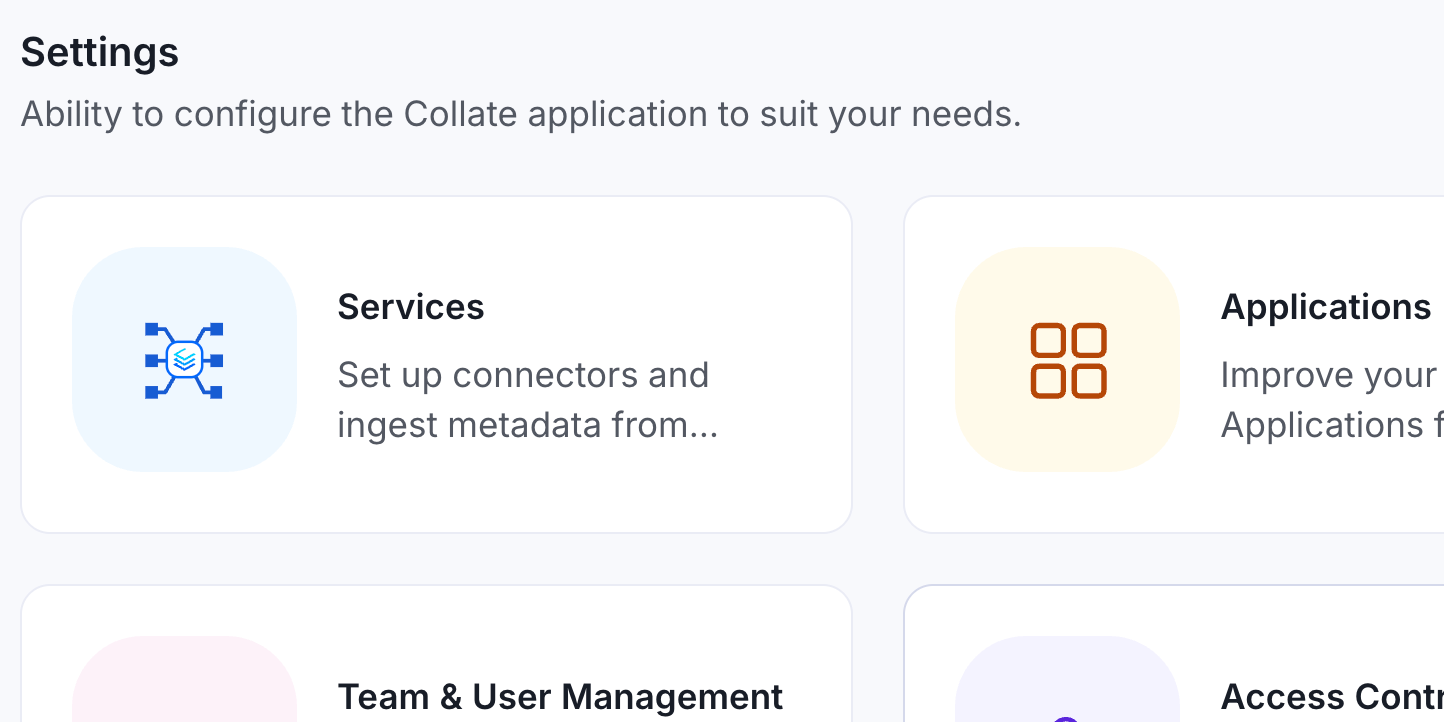
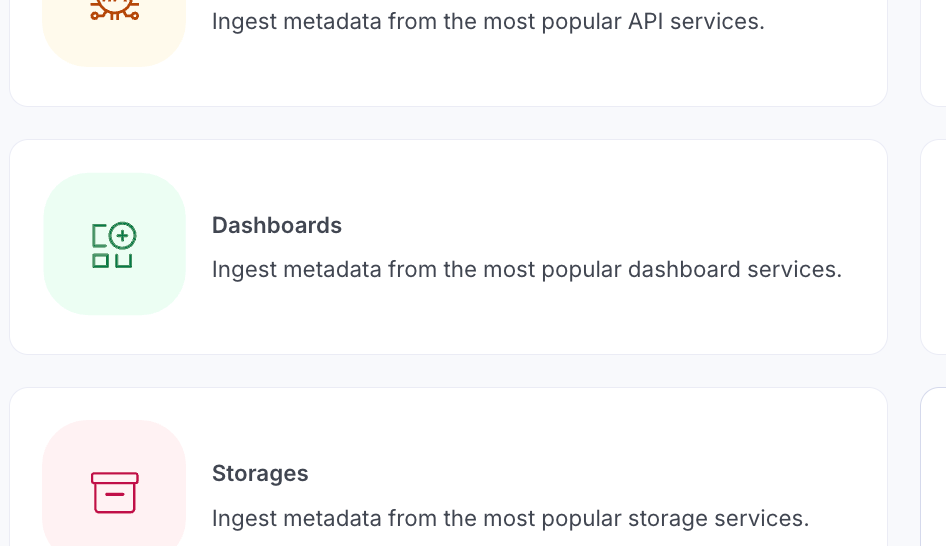
The initial setup process for connecting Collate to Superset is straightforward. Starting from Collate's landing page, navigate to Settings > Services > Dashboards, where Superset can be easily located among the extensive list of supported connectors. The process looks like this:
1. Navigate to Settings: Begin by accessing the services section in Collate's settings.

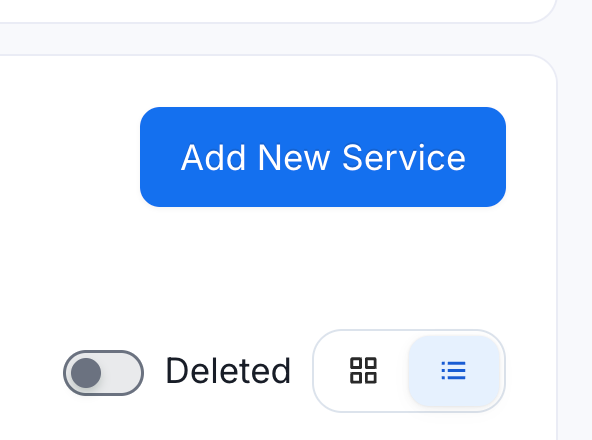
2. Add New Dashboard Service: Select “Services”, then “Dashboards”, then "Add New Service" and search for Superset in the service list.


Connection Details
Fill in your connection information to match your Superset installation.


What Gets Ingested
FThe connector ingests three distinct asset types, each serving a different purpose:
Data Models sit at the foundation. These are SQL queries that transform raw transactional data into aggregated, analysis-ready formats. Think of them as the translation layer between your database structure and the information analysts actually need. A data model might aggregate vaccine candidate data by phase and country, for example, turning raw records into meaningful summaries.
Charts represent individual visualizations, histograms, bar charts, and line graphs, each telling a specific story about the data. Charts are built on data models and present aggregated information visually.
Dashboards compose multiple charts into cohesive analytical views. They're the high-level interface where business users interact with data, combining related visualizations to answer broader questions.
This hierarchy becomes visible in Collate, helping teams understand how their BI assets relate to each other and to underlying data sources.
SQL Transparency
For any data model in Collate, you can view the actual SQL that Superset uses to generate the dataset. This isn't just display-only documentation; there's a copy-to-clipboard button that lets you reproduce queries elsewhere.
This transparency serves multiple purposes. Data engineers can validate query logic without opening Superset. Analysts can understand exactly what data they're working with. And when troubleshooting dashboard issues, seeing the underlying SQL often reveals the problem immediately.
Context Through Metadata
A significant advantage of bringing Superset assets into Collate is the ability to add context that doesn't exist in the BI tool itself. At every level, data models, dashboards, and individual charts, teams can add descriptions, tags, and glossary terms.
Consider a chart titled "Age Distribution of Respondents." Standalone, this could mean anything. But when you can see it's part of a COVID-19 vaccine Dashboard, connected to a data model about vaccine survey responses, the context becomes clear. You're looking at demographic data from people who responded to vaccine surveys, not patient age distributions or population demographics.
This semantic understanding matters for both human users and AI systems trying to make sense of data. Without context, "respondents" is ambiguous. With proper metadata and hierarchical relationships visible in Collate, its meaning becomes unambiguous.
Tagging at Scale
Tags and glossary terms can be applied at multiple granularities, from the data model down to individual columns. This enables governance policies to travel with the data as it is transformed into visualizations.
If a column in a data model is tagged as sensitive or PII, that classification should ideally carry over to any charts that use that data. By managing these tags in Collate, teams establish governance that spans from source systems through BI layers.
Centralized Documentation
This integration addresses a fundamental challenge: documentation sprawl. Without a centralized system, understanding your data ecosystem requires opening multiple tools, navigating different interfaces, and mentally stitching together relationships across systems.
Collate provides that single pane of glass. Instead of documenting dashboards in Superset, data models in a wiki, and source tables in yet another system, everything lives in one place with clear relationships between assets.
A significant benefit also emerges when dashboards connect to source systems already documented in Collate. Lineage automatically stitches together, showing the data flow from source tables through transformations to visualizations.
This end-to-end visibility transforms governance from a compliance checkbox into a practical tool. When a dashboard shows unexpected numbers, lineage reveals exactly which upstream data sources and transformations contributed to those results.
The View in Superset Button
Despite the value of centralized metadata, analysts still need quick access to the actual dashboards and visualizations. The "View in Superset" button enables instant context switching—review governance and documentation in Collate, then jump directly to the live dashboard with one click.
This bidirectional workflow eliminates friction. Governance doesn't pull users away from their work; it augments their workflow by providing additional context when needed while maintaining easy access to the tools they use daily.
Conclusion
The Apache Superset connector is available through Collate's standard integration framework. Teams already using Superset can begin ingesting metadata with just authentication credentials and connection details. From there, it's a matter of enriching metadata, adding descriptions, defining tags, and documenting the business context to make data assets truly understandable.
The Superset connector is available out of the box with Collate, and the public documentation provides detailed setup instructions and requirements. The metadata agent handles most of the heavy lifting, pulling connection strings, queries, and relationships needed to build comprehensive lineage maps.
For organizations committed to open-source tools without sacrificing governance, this integration proves that you don't need to choose between flexibility and control. You can have both.
To explore further, consider the Collate Free Tier for managed OpenMetadata or the Product Sandbox with demo data.
Fashion Retailer Mango’s Data Journey with Collate
Read the case study

Sign up to receive updates for Collate services, events, and products.
Share this article


Ready for trusted intelligence?
See how Collate helps teams work smarter with trusted data