


Know your data health so you can act
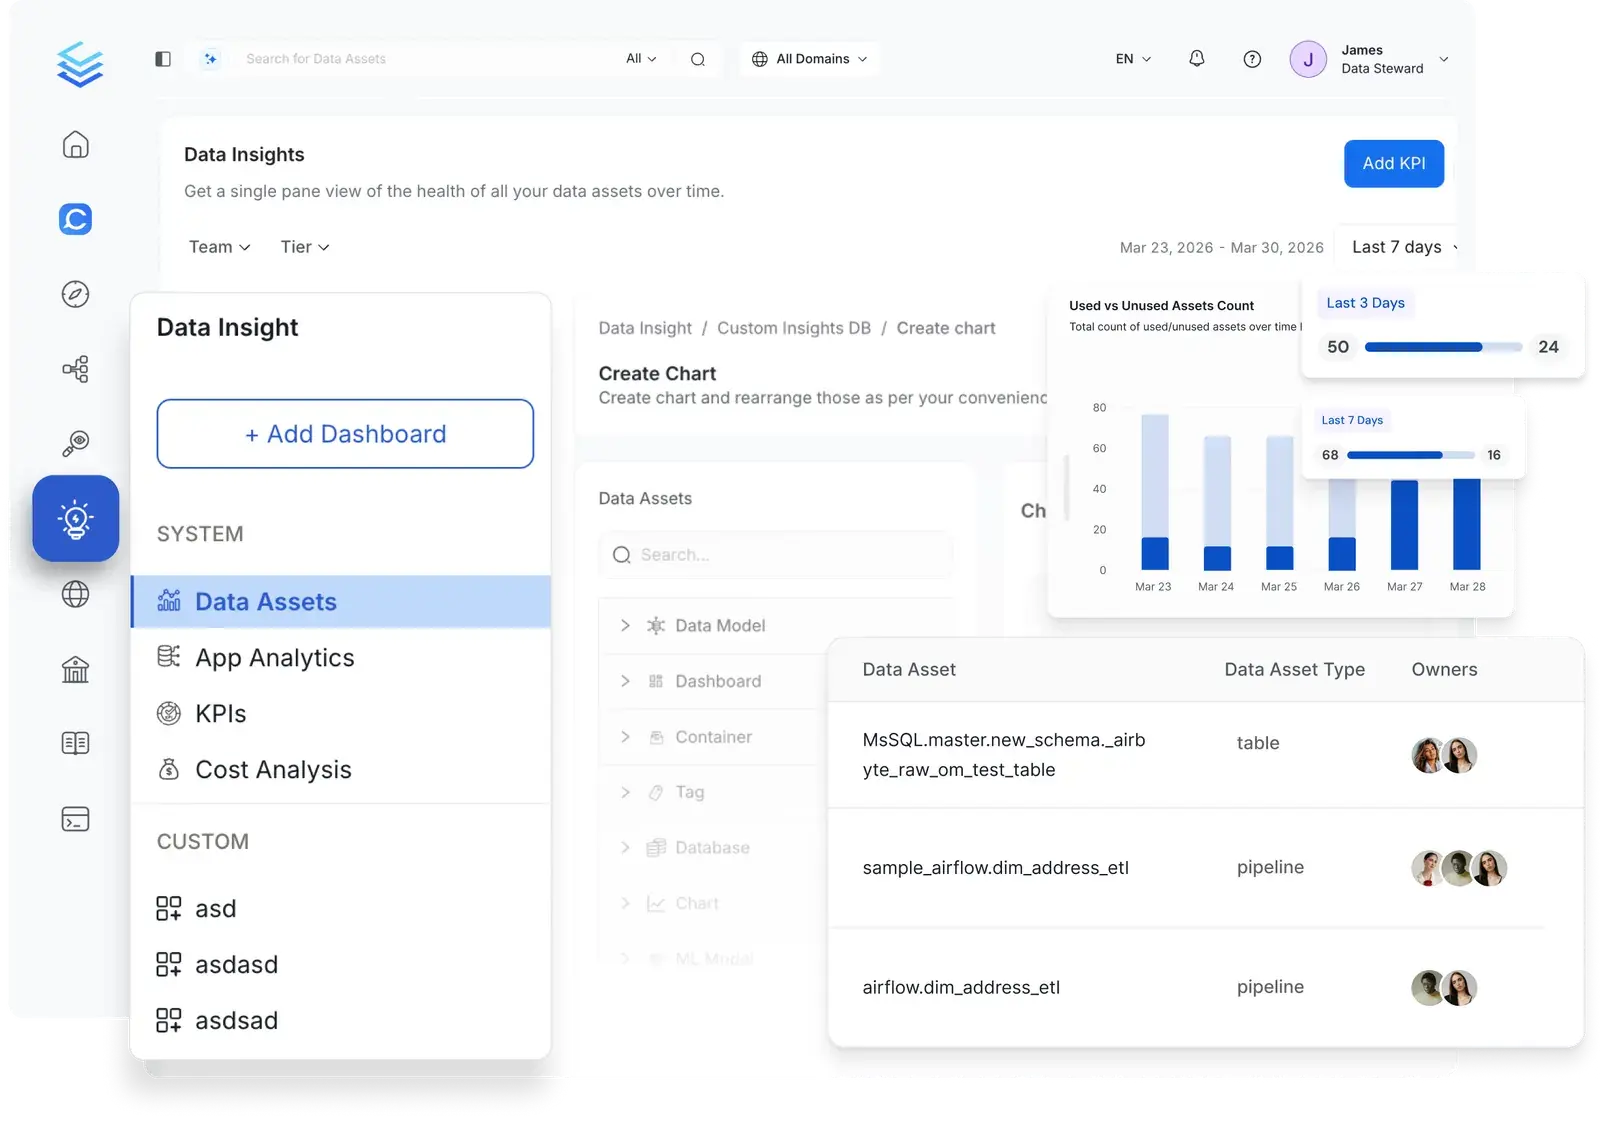
Org-wide data health (coverage, ownership, tiering, and usage) in one filterable view

Set goals, drive accountability
Time-bound KPIs for every team, tracked daily so progress is always visible

Cut waste before it compounds
Identify unused assets and surface infrastructure costs before they grow out of hand
Know Your Data Health So You Can Act
Org-wide visibility into data health, adoption, and service coverage
![[object Object]](/_next/image?url=%2Fimages%2Fdata-insights%2Fdata-assets-report.png&w=3840&q=75)
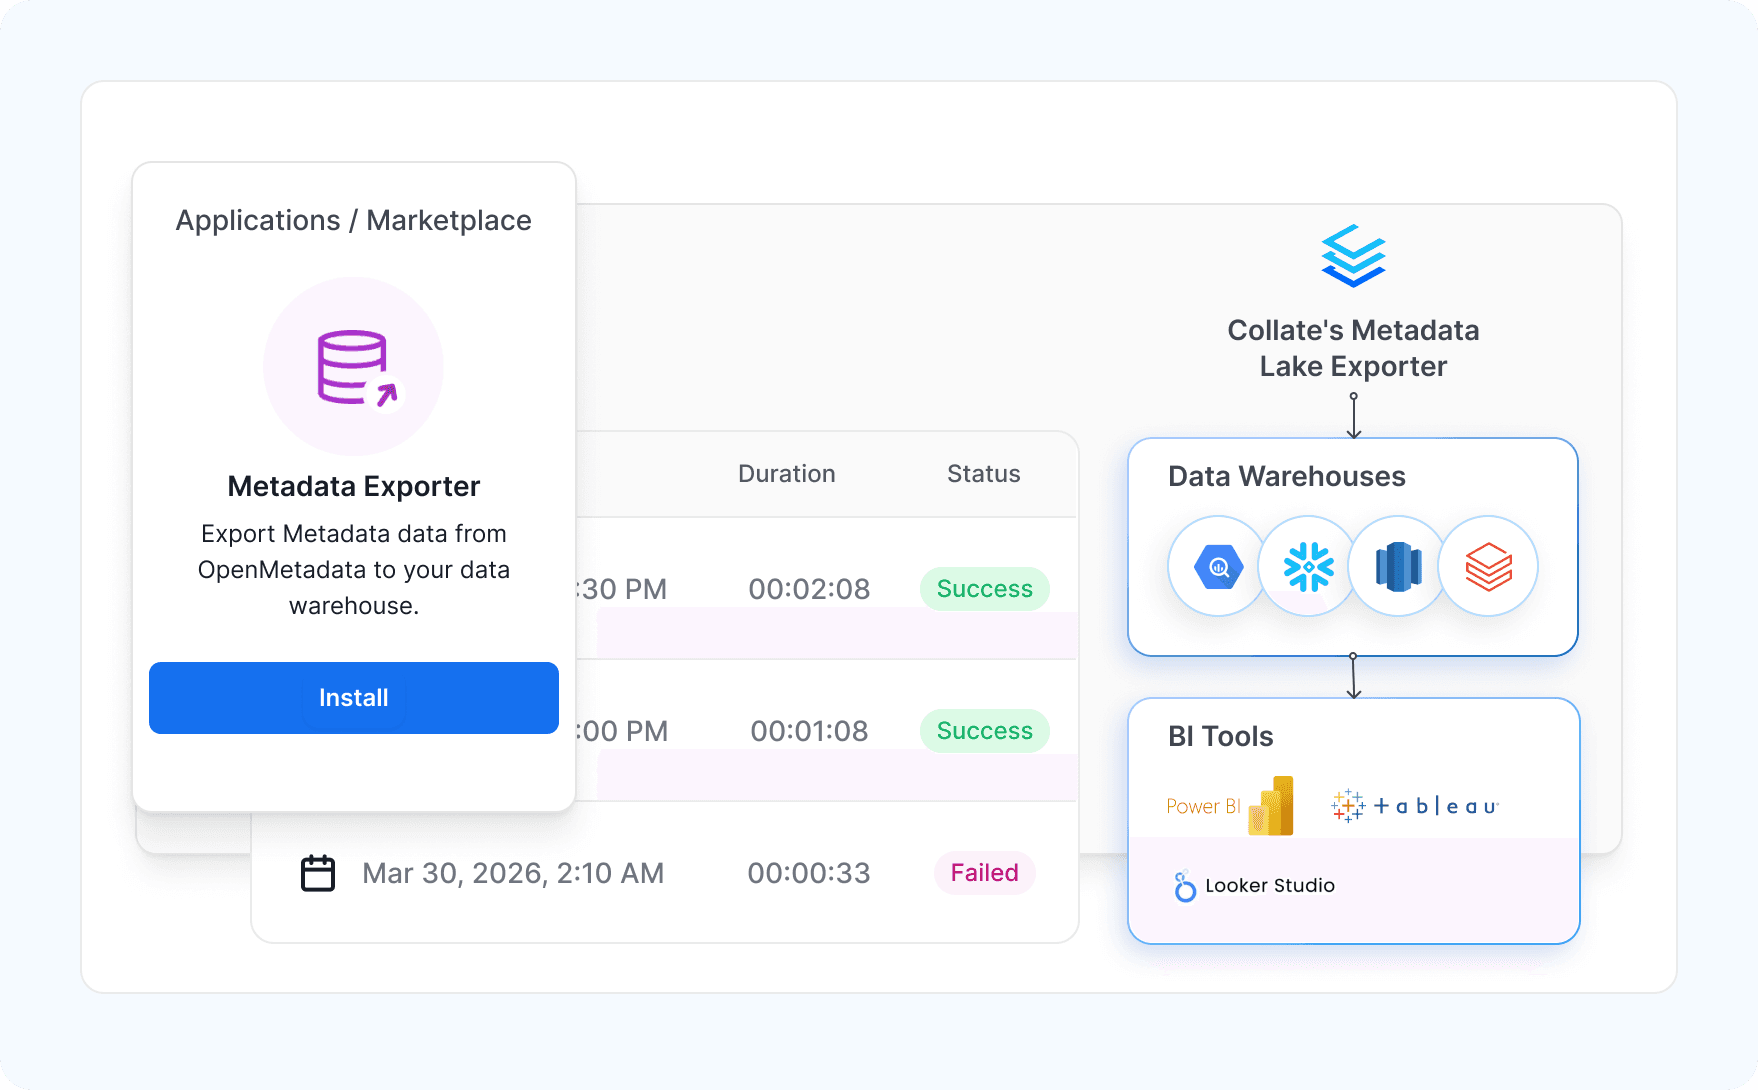
Most data catalogs trap your metadata behind their own dashboards. Collate's Metadata Exporter streams your complete metadata to Snowflake, Databricks, BigQuery, Redshift, or Trino, ready to analyze in Power BI, Tableau, or Looker. Your metadata should flow to your tools, not force you to theirs.

Set Goals, Drive Accountability
Time-bound KPIs and automated reporting to drive data program accountability
![[object Object]](/_next/image?url=%2Fimages%2Fdata-insights%2Fcompany-wide-kpis.png&w=3840&q=75)
Cut Waste Before It Compounds
Identify unused assets and optimize your data infrastructure spend
![[object Object]](/_next/image?url=%2Fimages%2Fdata-insights%2Fused-vs-unused-analysis.png&w=3840&q=75)
Built for modern data & AI practices
Designed for changing needs of data & AI teams
AI-Driven Automation
Improve productivity, enforce governance and reduce costs with AI driven automation
Unified Platform
One platform for all your teams for data discovery, observability and governance
Collaborate Around Data
Accelerate development of data assets with social workspaces and knowledge centers
Get started with Collate today for free
Get Collate FreeManaged Service for Production Data Teams
Book a DemoFAQs
Data Insights is Collate's built-in analytics layer for measuring the health, adoption, and cost of your data estate. It gives data leaders a single-pane-of-glass view of coverage, usage, KPI progress, and cost, grounded in semantic metadata definitions that ensure KPIs reflect business meaning consistently across your organization. Time-bound KPI targets create concrete accountability for data program goals.
Collate supports KPIs for description coverage and ownership coverage. Admins set percentage or absolute targets with a start and end date. Progress is tracked daily with a trend line chart, and weekly email reports keep teams and leaders informed without requiring anyone to log in.
The Cost Analysis report (Collate only) combines usage lifecycle data and storage size from the profiler workflow to identify used vs unused assets. Area charts show unused data growing over time, and an actionable list gives you specific asset names, last-access dates, and storage sizes to act on. Currently supported for Snowflake.
Yes. Beyond the default reports (data assets, app analytics, KPIs, cost analysis), Collate supports fully custom dashboards. You can chart any entity type (tables, glossary terms, data products, tags) using count/sum/avg functions or custom formula expressions with advanced filters. Teams have used this to build governance scorecards, glossary coverage dashboards, and domain-specific reporting.
Yes. Metadata Exporter (add-on) exports your complete Collate metadata to your own data warehouse: Snowflake, Databricks, BigQuery, Redshift, or Trino, in a documented, queryable format. From there, you can analyze it in Power BI, Tableau, Looker, or any BI tool your organization already uses. Unlike built-in dashboards, Metadata Exporter gives you full control: combine metadata with other data sources, run your own transformations, and build governance dashboards your stakeholders already know how to use.
Data culture requires visible goals, shared accountability, and regular feedback loops. Data Insights provides all three: KPIs make targets public and time-bound, weekly email reports keep teams honest, and app analytics show who is actually using the platform. Leaders can recognize teams improving their coverage, and domain owners can see exactly where to focus next.
Accuracy is driven by the shared definitions in the semantic metadata grounding. Without shared definitions, different teams measure 'customer,' 'revenue,' or 'active user' differently. When KPIs are grounded in semantic metadata, every metric is calculated against the same governed business definition, eliminating measurement inconsistency across your organization. This means your documentation coverage KPI, your ownership targets, and your cost metrics reflect what's actually true, not what different teams interpret the data to mean. The result is metrics stakeholders trust.