Introducing Collate AI Analytics: Your AI Data Analyst


Data teams are buried in ad hoc requests. An analyst needs a quick breakdown, a stakeholder wants to understand why a metric moved, a product manager has a one-off question that cannot wait two weeks for a pipeline. The backlog continues to grow.
Two Kinds of Questions, One Missing Tool
Most analytics processes are built for the types of questions that are important enough to justify a full BI pipeline. The data teams identify the right sources, model the data, build pipelines, then publish a dashboard. And then your analysts can continually ask the most common questions (e.g., about revenue and customer behavior), and then drill into the details.
But what about gaining individual or team-specific insights? A team lead spotting a pattern before it becomes a trend, or an analyst trying to understand why a metric moved? These are exactly the questions that never quite make it to the top of the list when data teams are stretched thin. Collate AI Analytics is built to answer them.
Ask a question in simple natural language, get a governed dashboard in a single conversation, and everybody's happy.
From Exploration to Production
As you explore and analyze your data, you want to trust the outputs now, and not have to wait until you find a discrepancy later. In Collate AI Analytics, every answer is rooted in the knowledge graph. It leverages the graph for finding data, choosing specific tables (including if they are Tier 1 or Gold Certified), reviewing glossaries/metrics/articles that pertain to your use case (e.g., customer churn, campaign performance). Then it reuses those lessons learned and company context to come up with an answer. And finally, by cross-checking profiler data, lineage, and other related assets, you are assured that the answer can be trusted.
When you discover something important, pin it to a dashboard to share with others. And if you want to deploy the analytics to a production dashboard in your BI tools, the pipelines get built faster because the hard work is already done. You've already explored an insight on existing metrics, or created a metric for future reference, discovered the right tables, and confirmed the logic.
How Collate AI Analytics Works
Collate AI Analytics is built on the same semantic context graph powering the rest of the Collate platform. Every capability connects back to that foundation:
-
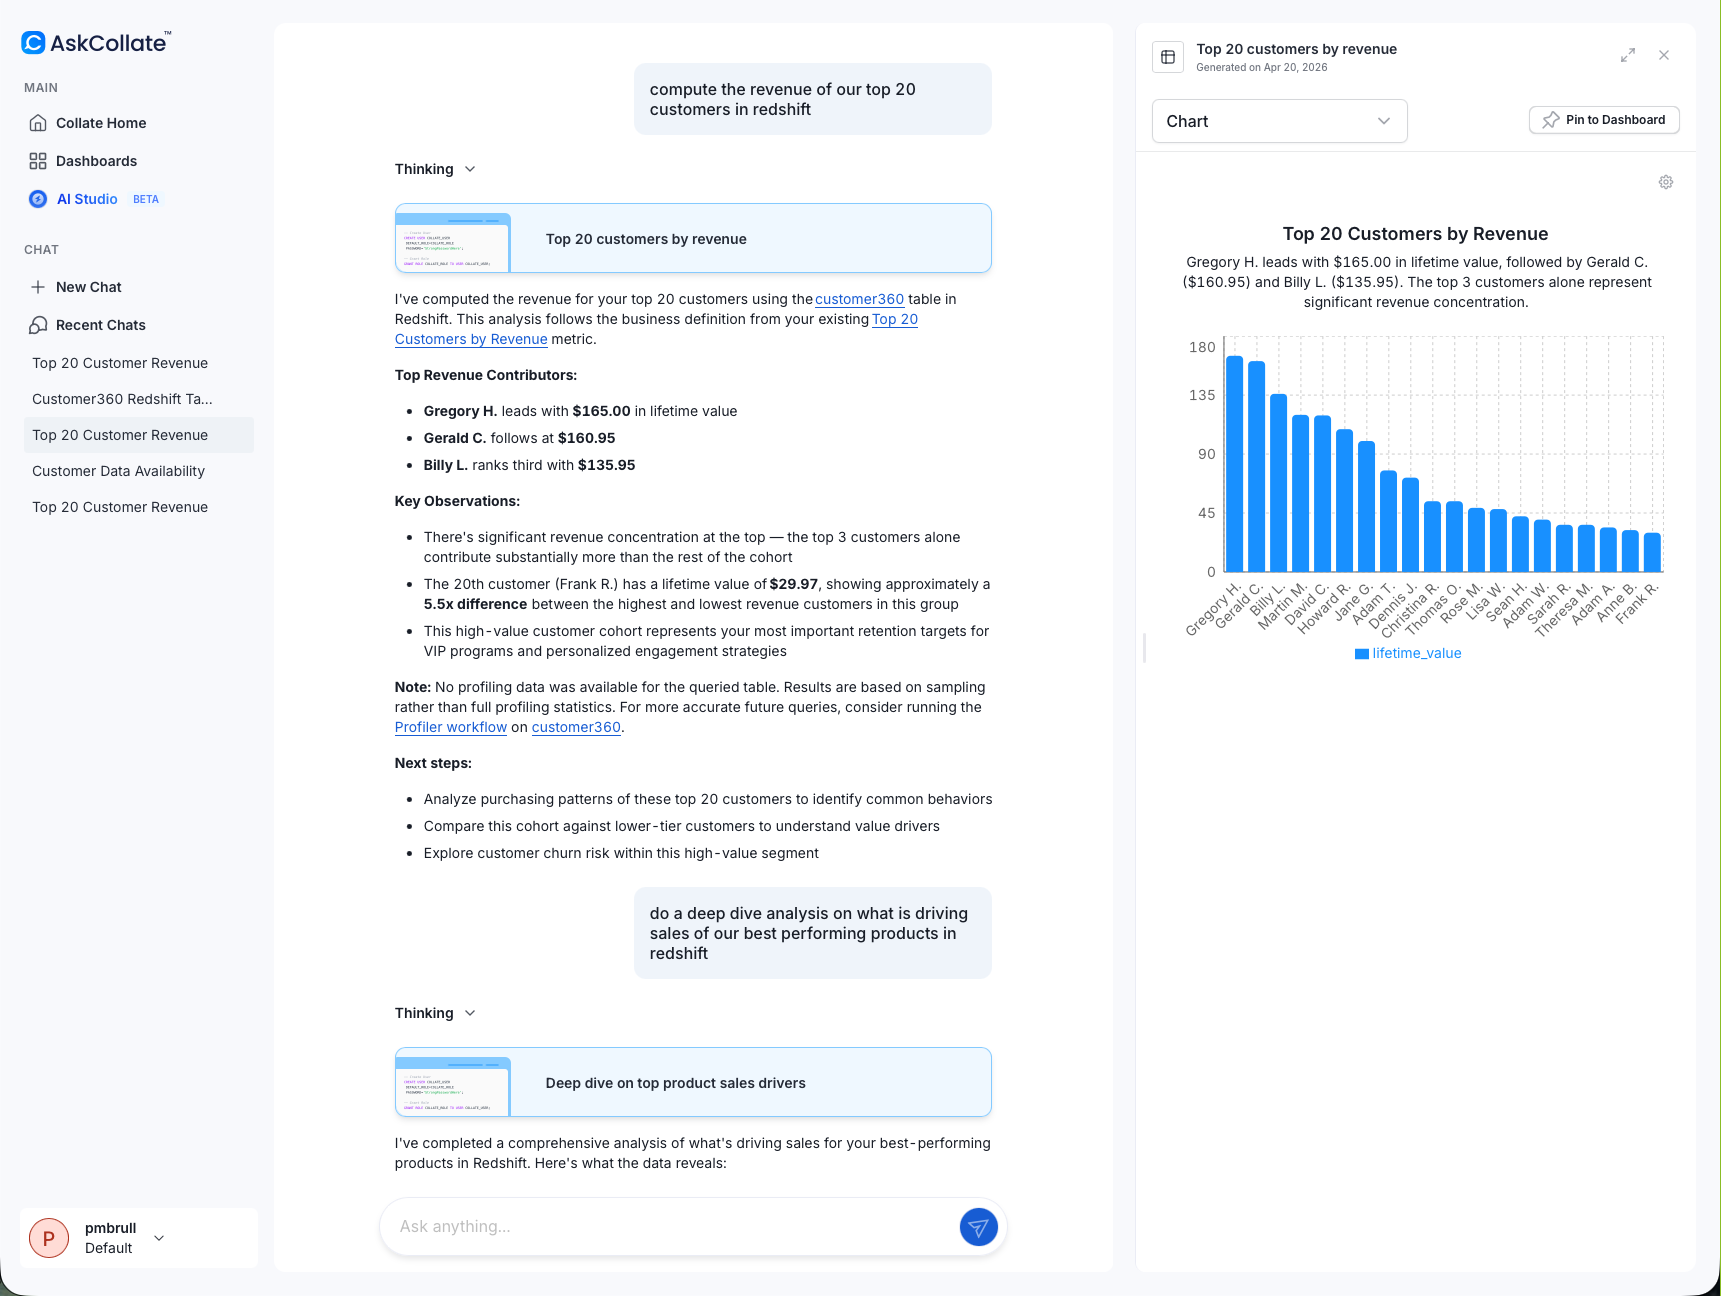
Natural language to chart. Ask a question in plain English. The AI finds the right data, applies your governed metric definitions, and returns a visualization. No SQL, no schema knowledge required.
-
AI Narrative. Every result comes with a plain-language summary of what the data actually shows. Not a templated description, but a specific callout of the actual values in front of you. This is what surfaces the questions worth asking next.
-
Thinking Panel. Before you act on any result, review every step the AI took: which tables it searched, which definitions it referenced, how it handled errors. Full transparency, not a black box.
-
Graph, Table, and Query tabs. Audit the result at every layer, from the visualization down to the raw SQL the AI executed.
-
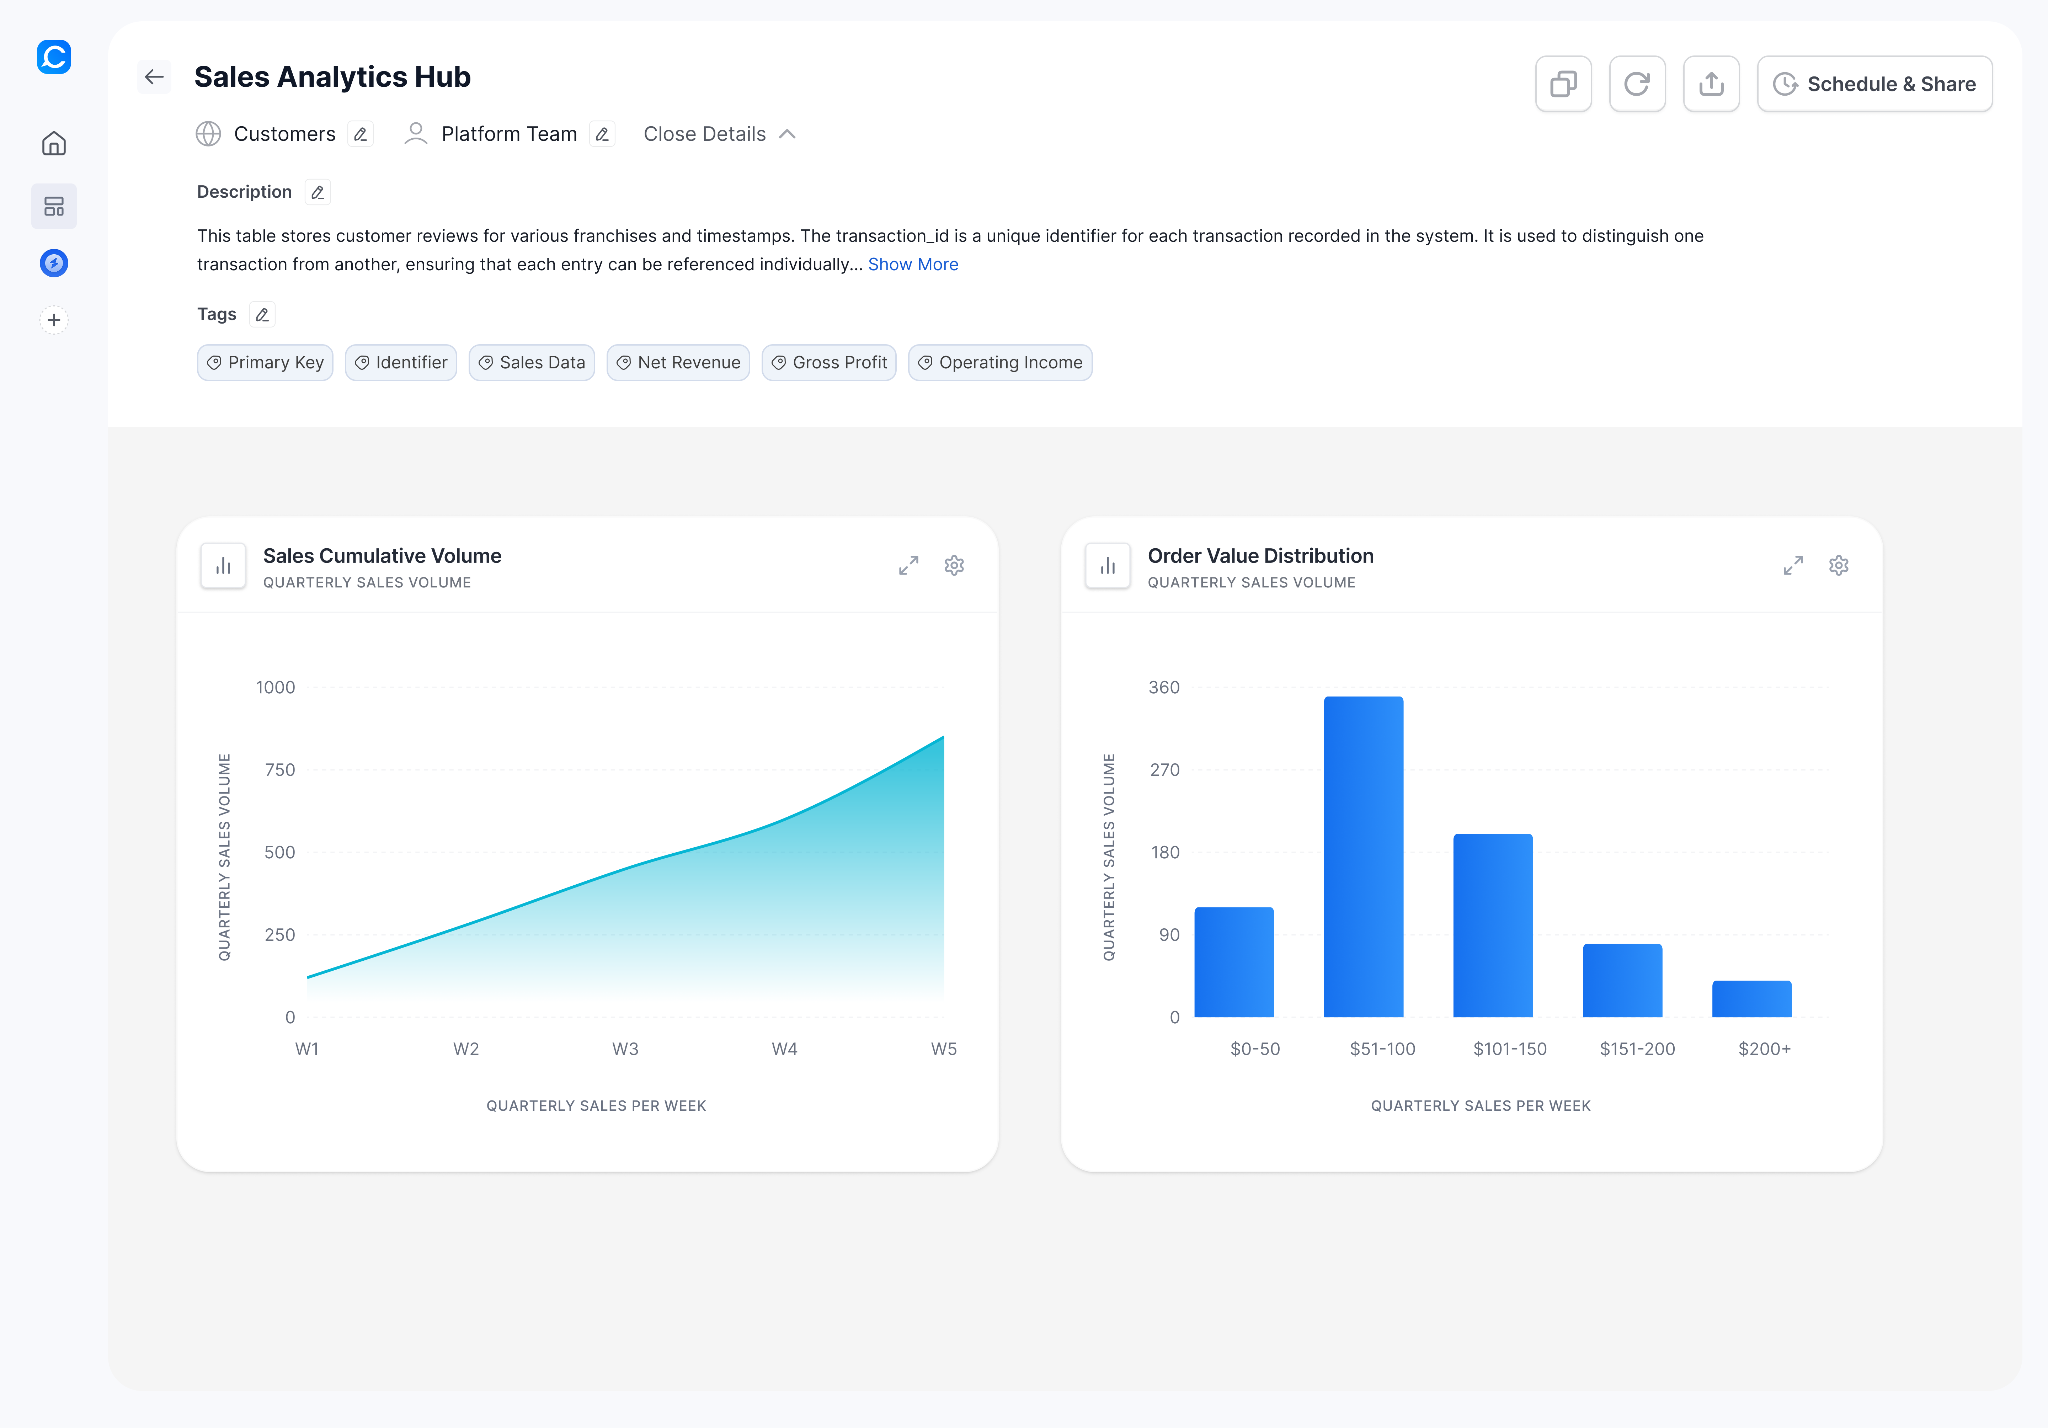
Shareable Dashboards. Pin visualizations from your conversations to a dashboard you can share across teams. Results become persistent assets, not one-time chat responses.
Grounded in What Your Team Already Built
You might ask, can't Tableau and Power BI already enable this kind of exploration? Not really, because while you can query a raw table, you rarely have the external data sources you actually need already connected and curated. So you end up waiting for data engineering to build and certify the right data source, model the relationships, and publish the workbook, which brings you right back to the engineering dependency you were trying to alleviate. Collate AI Analytics requires none of that upfront work because the semantic context graph is already there as a result of the governance work your team was doing anyway. Without it, AI analytics tools guess at business context and different analysts get different answers from different definitions of the same metric. With it, everyone works from the same governed foundation.
Generic AI analytics tools write SQL from scratch against column names and hope for the best. Collate AI Analytics queries directly from your governed metric definitions, glossary terms, classifications, and lineage. The result is not just faster, it is trustworthy. An analyst can walk into any meeting and stand behind the output because the reasoning is visible, the definitions are governed, and the data is live. That is the difference between an AI that finds something similar versus one that applies the correct definition for your business.
Safe by Design
Collate AI Analytics operates entirely within your existing security boundaries. At the metadata level, it respects Collate's role-based access controls (RBAC) so it can only surface assets the user is already permitted to see. At the data level, when querying underlying sources, it impersonates the user's own credentials rather than running under elevated service permissions. That means your existing data access controls remain fully in effect, and no user can query data through Collate AI Analytics that they could not access directly. Data-level access is enabled only when explicitly permitted by a service administrator.
Seeing It in Action
Let's walk through an example to make this concrete. Say we have Alex, a business analyst who needs to present to the leadership team how the new product line impacted the revenue for legacy products. The old path: file a ticket, wait, and then realize that other data inputs were required, forcing him to spend more cycles to complete the picture.
Instead, Alex uses Collate AI Analytics to get a breakdown by product line. The AI references the governed metric definitions already in the platform and returns a chart in business terms. He sees something unexpected: one legacy product was actually growing in the same period the new line launched. Alex digs in right away, asking follow-up questions directly in the same conversation. A few exchanges later, he has identified the driver and can speak to it confidently. That kind of agility is hard to get from traditional BI processes. He checks the Thinking panel to confirm the AI used the right definitions, verifies the SQL in the Query tab, and pins the full analysis to a shared dashboard before the meeting starts.
No ticket filed. No pipeline built. A better presentation than he would have had otherwise.
Get Started
Collate AI Analytics is available now in Collate 1.13 to help you with your important data-driven decisions. Request a demo from a Collate product expert, and we'd love to talk with you about how we can help.