Best Data Observability Tools to Get Your Data Under Control [2025]
What Are Data Observability Tools?
Data observability tools are software applications that enable organizations to understand the state and health of their data, data pipelines, and data infrastructure. They provide insights into data quality, performance, and cost, helping teams to detect, diagnose, and resolve data issues efficiently.
The primary goal of data observability tools is to improve the confidence of analytics, machine learning, and decision-making. By surfacing anomalies, tracing data lineage, and automating quality checks, these tools reduce the time spent troubleshooting data issues. Their monitoring and alerting capabilities help meet compliance and governance requirements.
Here are some of the main features of data observability tools:
- Automated data quality checks: These tools monitor schema changes, data freshness, volume, and distribution to identify anomalies.
- End-to-end data lineage: Visualizing data flow from source to destination helps understand the impact of data issues.
- Root cause analysis: Pinpointing the source of problems, such as broken pipelines or missing data, is crucial for efficient resolution.
- Alerting and notifications: Configurable alerting systems notify teams about potential issues, ensuring timely responses.
- Anomaly detection: Machine learning capabilities help identify unusual patterns and potential data quality problems.
- Incident management: Tools to track, manage, and resolve data incidents effectively.
- Performance monitoring: Identify bottlenecks and performance issues in data pipelines and infrastructure.
- Cost monitoring: Track and manage the cost of data infrastructure and identify potential cost savings.
Key Features of Data Observability Tools
Automated Data Quality Checks
Automated data quality checks validate data across dimensions such as completeness, accuracy, uniqueness, consistency, and timeliness. Rules and thresholds align with business logic, while automated scans provide round-the-clock coverage. Teams can catch dirty data early in ingestion or processing, minimizing the risk of propagating errors to analytics or production systems.
A strong data quality check system adapts as data models evolve, supports custom rules for specific data types, and integrates with source control workflows. Automated documentation and issue tracking enable teams to collaborate on resolving anomalies, and detailed reporting provides transparency into quality trends over time.
End-to-End Data Lineage
End-to-end data lineage tracks the movement and transformation of data from origin to its destination. This visual mapping shows every step—such as ingestions, transformations, joins, and splits—allowing teams to understand how raw data becomes analytical outputs. Lineage maps are critical for debugging, compliance auditing, and change impact analysis because they clarify dependencies and expose breakpoints or errors in the data flow.
Maintaining lineage at scale requires integration with a variety of data sources, orchestrators, and processing engines. Top observability tools automate the capture and update of lineage metadata, reducing manual documentation efforts. They also let users jump between upstream and downstream assets, ensuring that any anomaly or schema change can be traced back to its origin quickly.
Root Cause Analysis
Root cause analysis helps teams isolate the reason behind data quality incidents or pipeline failures. Observability tools aggregate metrics, logs, and lineage information to correlate patterns and pinpoint where and why anomalies occurred. This reduces mean time to resolution by clearly identifying problematic queries, source system outages, code deployments, or external dependencies, allowing for fast remediation.
Modern platforms improve root cause analysis with AI-driven suggestions and contextual evidence—such as before-and-after snapshots or historical trends—that support hypothesis testing. By simplifying investigations, these tools enable data engineers to focus on preventing future occurrences.
Alerting and Notifications
Alerting and notification systems are critical for proactive data management. Data observability tools can detect anomalies or quality violations in real time and immediately notify relevant team members through email, messaging platforms, or incident management systems. Configurable thresholds help control noise, ensuring that alerts highlight only meaningful deviations or failures.
These platforms also support customizable escalation policies, routing critical alerts to the right roles, such as data engineers or business analysts. Integration with workflow tools means teams can acknowledge, track, and resolve incidents without leaving their existing communication environments.
Anomaly Detection
Anomaly detection capabilities in data observability tools use statistical models and machine learning algorithms to spot unusual patterns in data volumes, values, or schema changes. Unlike hardcoded rules, anomaly detection adapts to expected fluctuations, accurately flagging only truly outlier events. This uncovers issues like sudden drops in metrics, spikes in errors, or unexpected data distributions that manual checks would miss.
By embedding anomaly detection into pipelines, organizations gain early warnings about subtle shifts before they escalate. Detailed context—such as sample rows, impact assessment, and comparison with historical baselines—enables rapid triage and resolution.
Incident Management
Incident management in observability tools centralizes the process for detecting, documenting, and resolving data issues. When problems are detected, these platforms allow users to create incidents, assign ownership, and capture relevant context such as affected datasets, impacted pipelines, and root cause details.
Comprehensive incident timelines and audit trails support post-mortem analysis and help teams build a knowledge base of common problems and solutions. By tracking incident history, organizations can identify recurring pain points, prioritize pipeline improvements, and demonstrate compliance with operational best practices or regulatory requirements.
Performance Monitoring
Performance monitoring tracks resource usage, latency, and throughput across data systems. Observability tools measure job execution times, query speeds, hardware utilization, and data processing bottlenecks, helping teams understand how infrastructure affects data delivery. Consistent monitoring identifies trends such as increasing delays or CPU spikes, prompting timely capacity planning or optimization.
Integrated dashboards synthesize performance metrics from disparate sources, providing a single, unified view. Custom alerts trigger when performance falls below agreed service levels. This stance on efficiency and scalability ensures data platforms can support growing workloads and evolving requirements.
Cost Monitoring
Cost monitoring gives visibility into spending on cloud resources, data warehouse compute, and storage used by data workloads. Observability tools break down costs by teams, projects, or pipelines, letting organizations identify expensive jobs, inefficient queries, or underused resources. Real-time and historical reporting supports budgeting, chargebacks, and more informed architectural decisions.
Automated anomaly detection in cost tracking can alert teams to unexpected increases due to runaway jobs or misconfigured resources. By correlating spend patterns with data activity, observability tools help reduce waste, justify investment, and optimize resource allocation, especially in dynamic, usage-based cloud environments.
Notable Data Observability Tools
1. Collate®

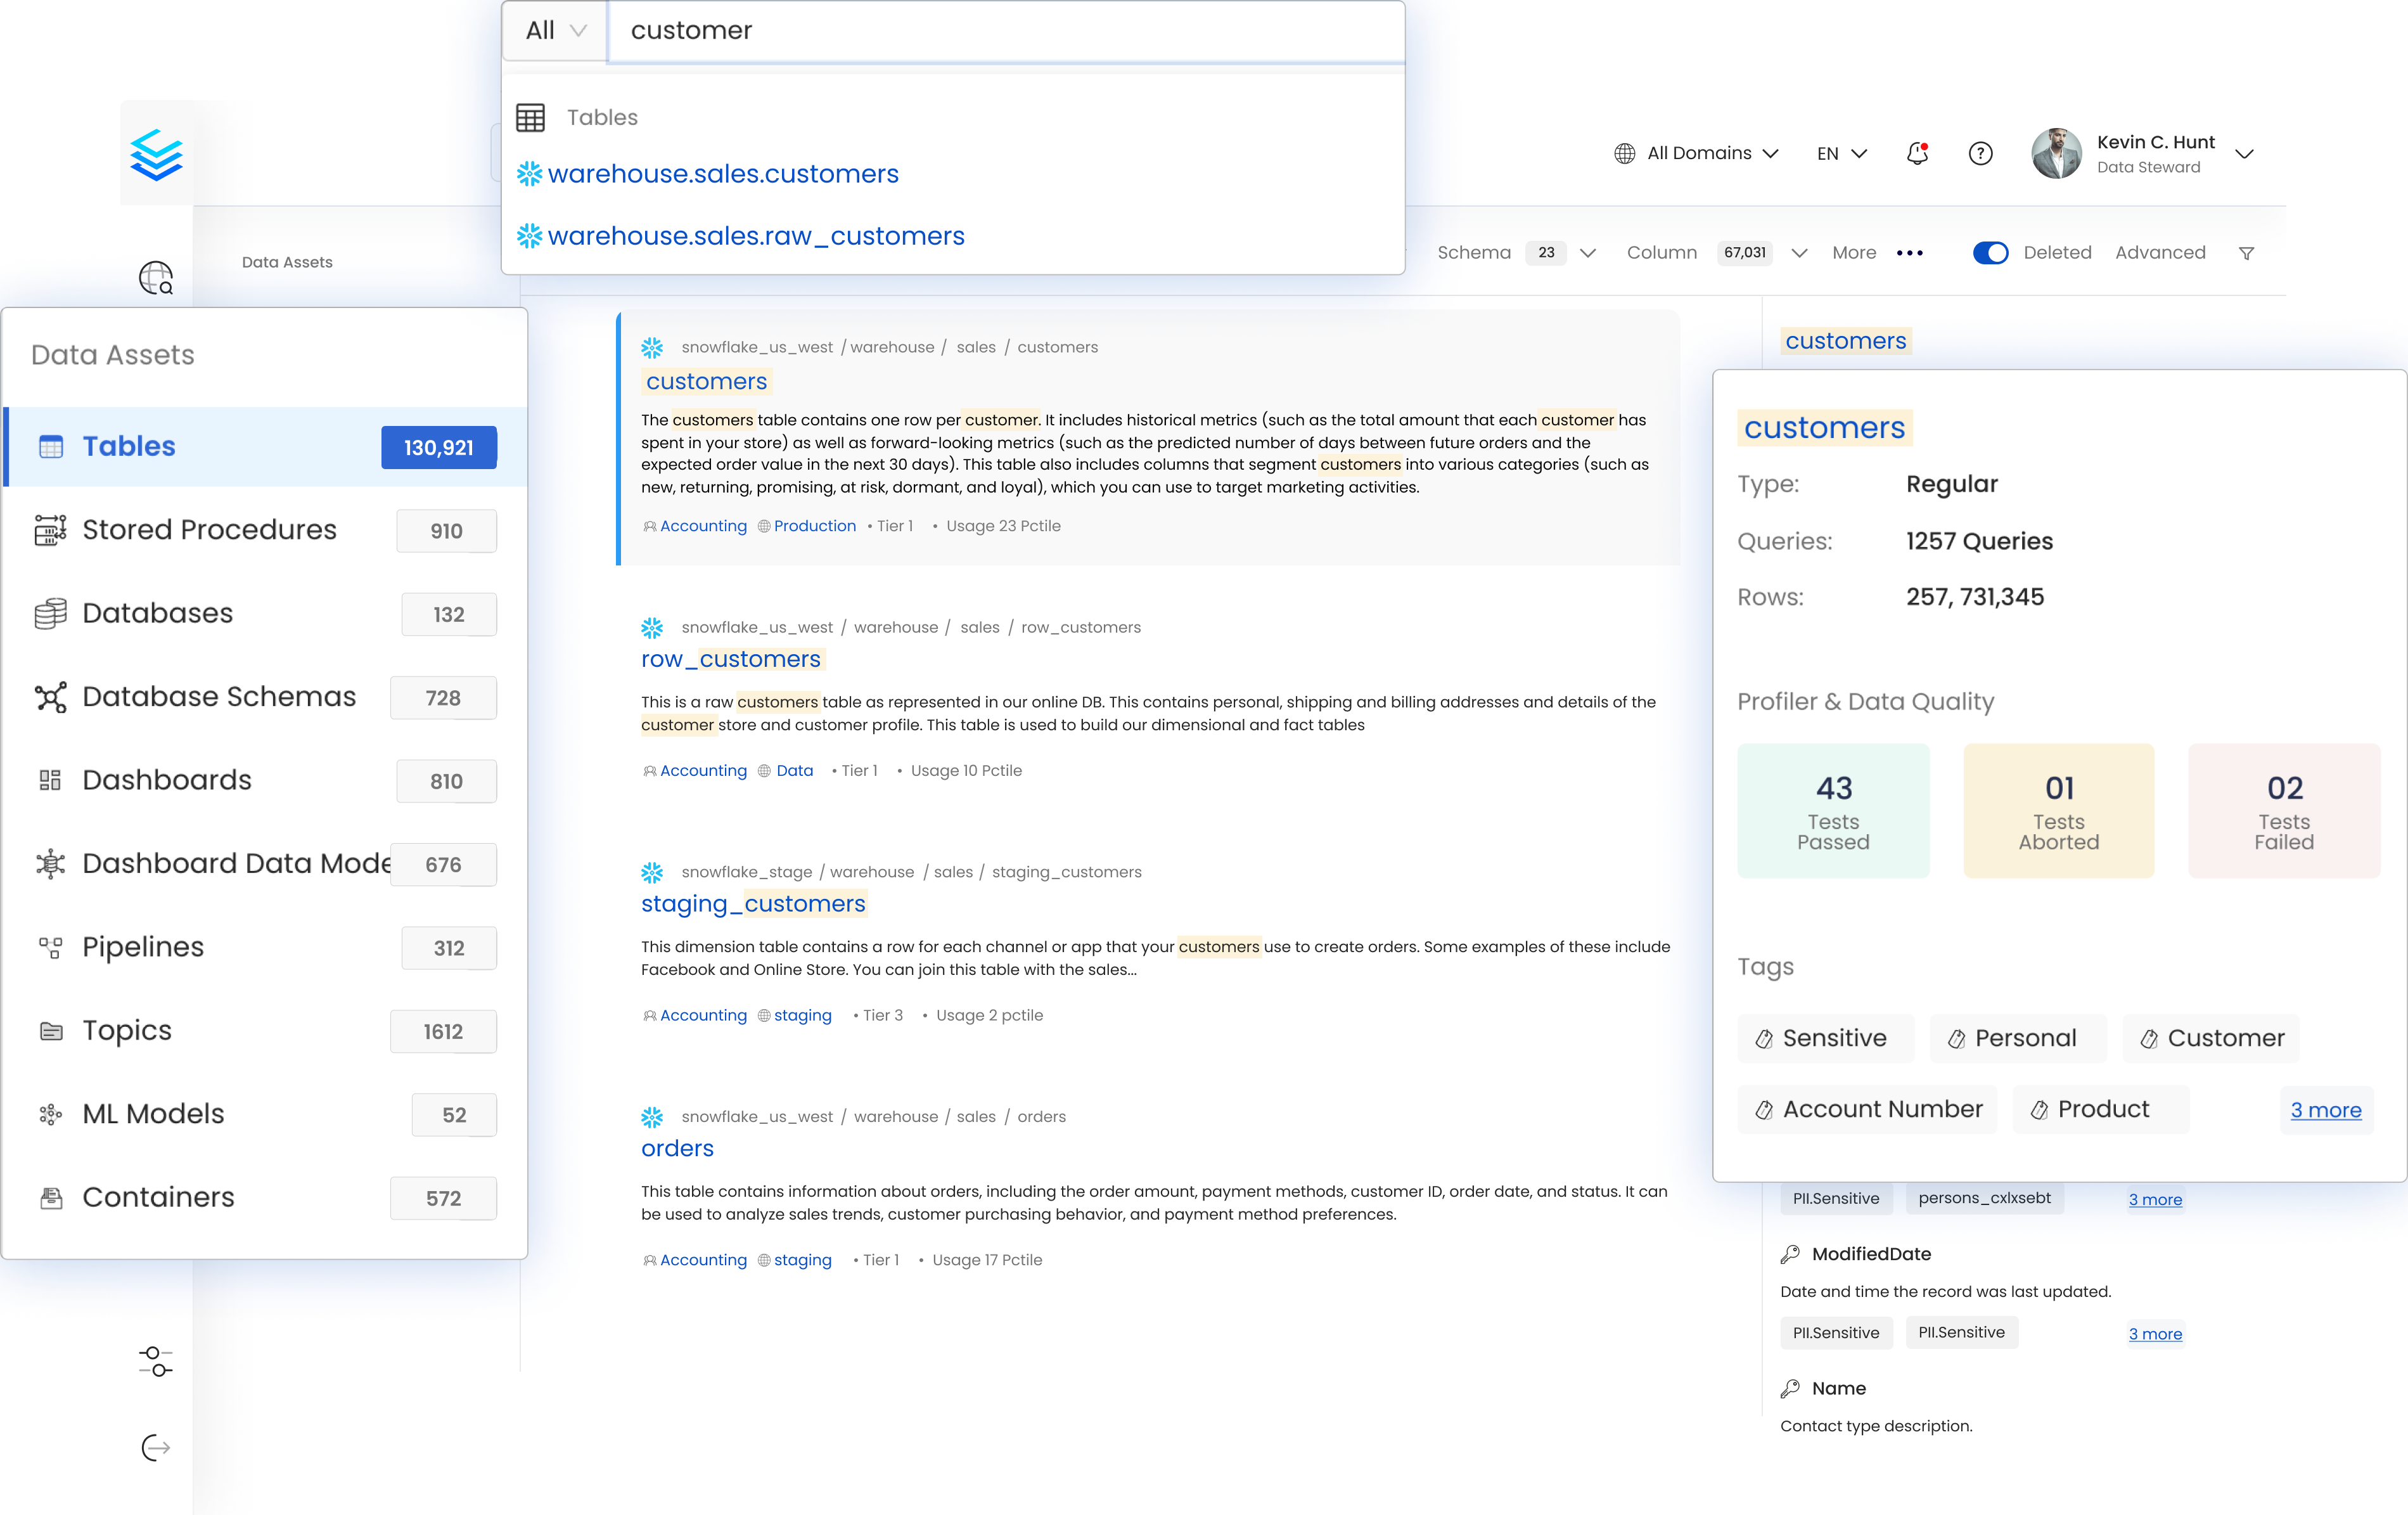
Collate is an AI-powered data observability platform that gives organizations end-to-end visibility into their data pipelines, health, and quality. It eliminates the need for multiple point solutions by unifying data observability with data discovery and governance capabilities. Built on the open source OpenMetadata project, Collate offers AI-driven automation and real-time monitoring capabilities that reduce mean time to detect (MTTD) and mean time to resolve (MTTR), making it easier to troubleshoot and prevent data issues across the entire stack.
Key features include:
- Real-time pipeline monitoring: Tracks ETL job execution, detects failures, and surfaces upstream and downstream quality issues through a centralized health dashboard.
- AI-powered data quality testing: Generates no-code and SQL-based tests for data accuracy, freshness, and custom metrics automatically on Day 1, helping teams catch quality problems early.
- Automatic data profiling: Offers deep insights into the shape of datasets, including null values, distributions, and other key metrics to support data validation.
- Incident management and collaboration: Centralizes alerts and issue tracking with an integrated incident manager that supports assignment, coordination, and communication across teams.
- Custom alerting and change management: Configurable notifications and schema change alerts ensure teams are informed of impactful modifications or failures.
- Root cause analysis and lineage views: Combines quality results with lineage information to help teams trace errors back to their origin and assess downstream impact.
- Cost and governance optimization: Designed to support modern data practices with AI-driven automation for governance enforcement and resource efficiency.

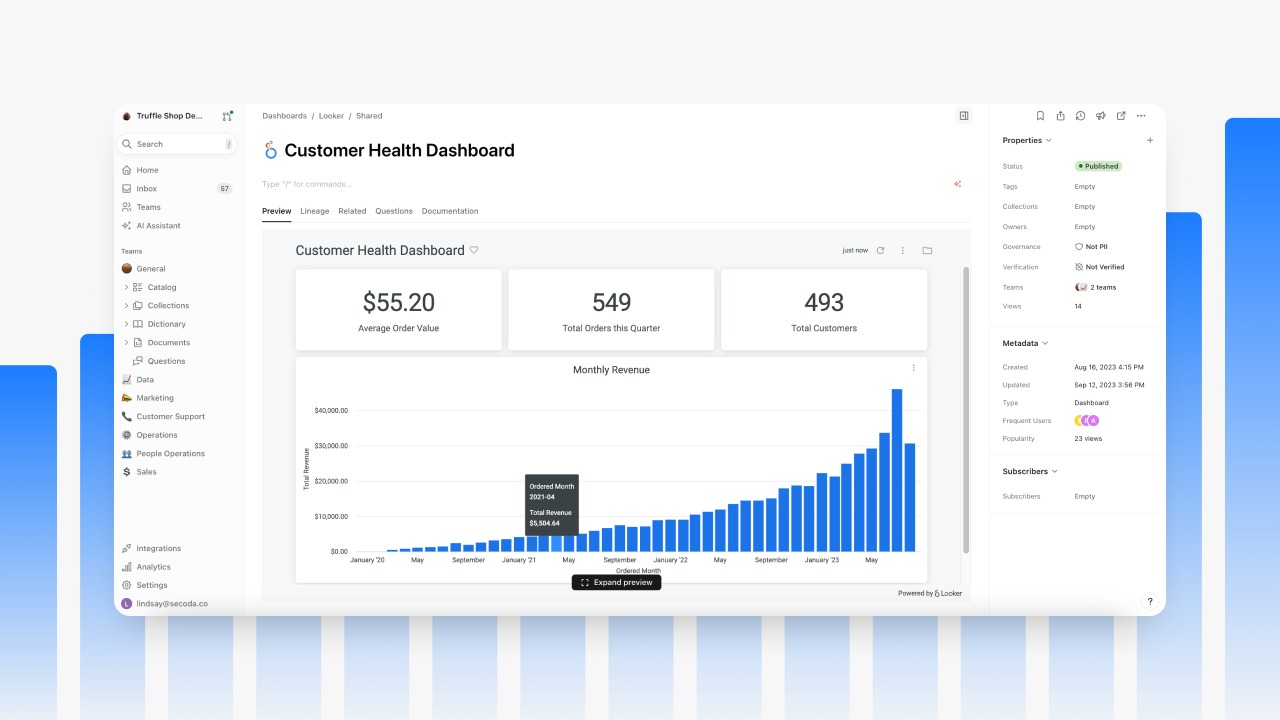
2. Secoda

Secoda is an observability solution that automates monitoring, alerting, and testing to ensure data reliability from ingestion to business intelligence. Its no-code setup and visibility into data pipelines, query performance, and costs allow teams to keep data quality high and operations efficient.
Key features include:
- Data pipeline monitoring: Offers visibility into pipelines, queries, costs, and jobs.
- Data quality monitoring: Enables no-code tracking of metrics like freshness and uniqueness, with automatic alerts for issue resolution.
- Query performance monitoring: Helps track query usage and performance, identifying bottlenecks early.
- Cost optimization: Breaks down costs by role, user, or warehouse, uncovering opportunities for cost reduction.
- Job performance monitoring: Centralizes tracking of jobs across tools, improving coordination.

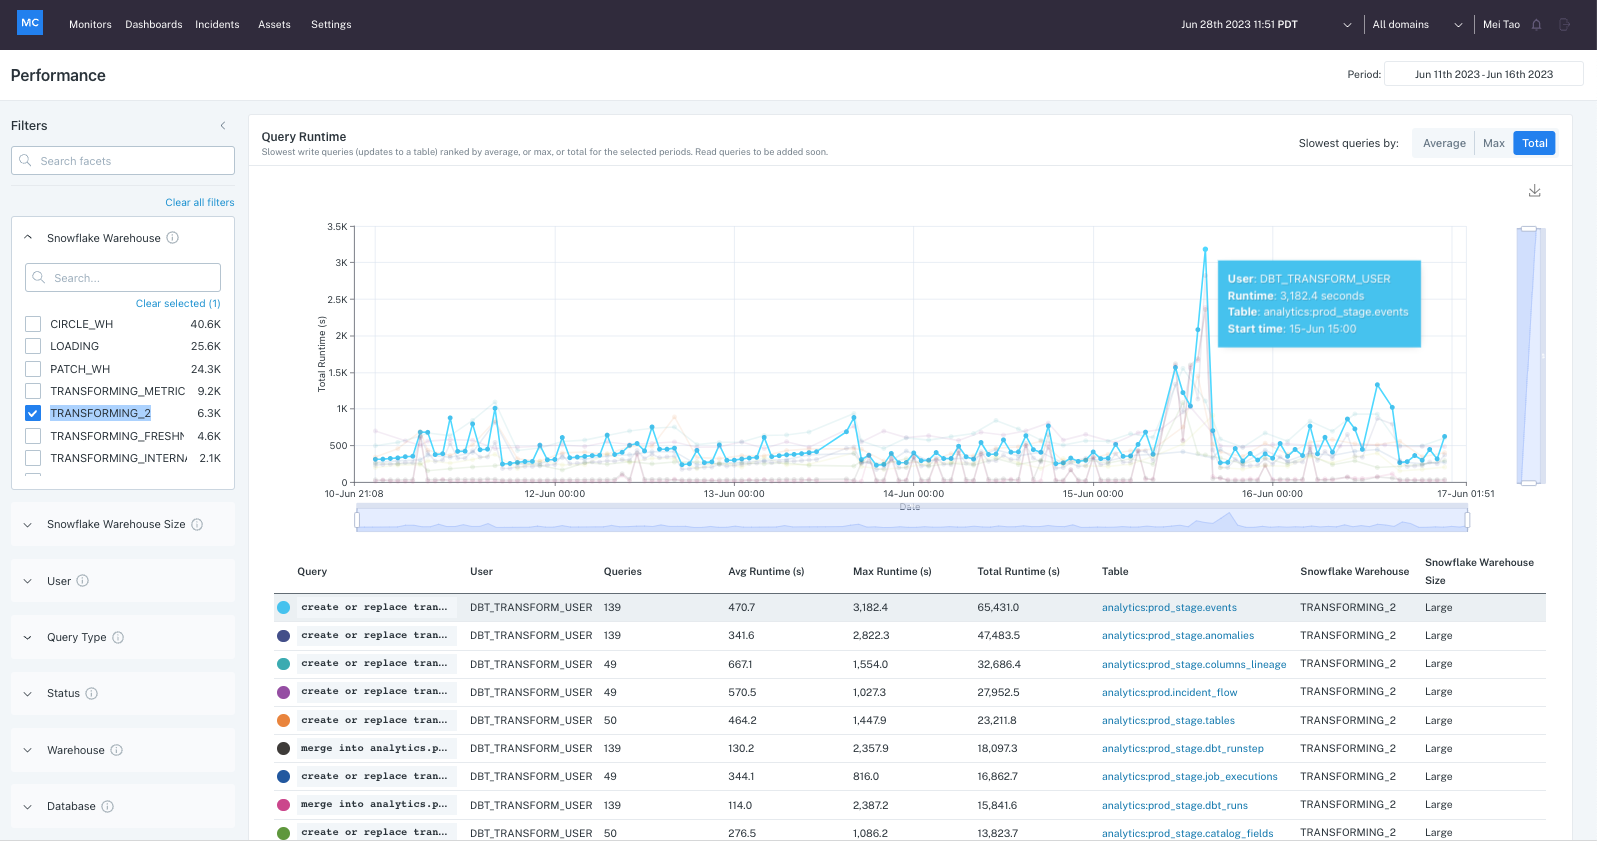
3. Monte Carlo

Monte Carlo is a data observability platform that prevents data reliability issues by providing continuous monitoring, root cause analysis, and automated incident resolution. It helps data teams detect, resolve, and prevent bad data by combining metadata analysis, AI-driven alerts, and cross-system lineage.
Key features include:
- Automated monitoring with AI: Deploys prebuilt and custom monitors that use AI to detect anomalies across data volumes, freshness, and schema changes without manual configuration.
- AI-driven root cause analysis: Correlates metadata, query changes, and system failures to quickly identify the source of incidents.
- End-to-end data lineage: Tracks data movement across systems, enabling users to trace issues to their origin and assess downstream impact.
- Impact analysis and incident management: Surfaces who and what is affected by issues, assigns ownership, and integrates with ticketing workflows for resolution tracking.
- Performance and cost optimization: Identifies slow or inefficient queries, validates SLA adherence, and flags unnecessary resource use across pipelines.
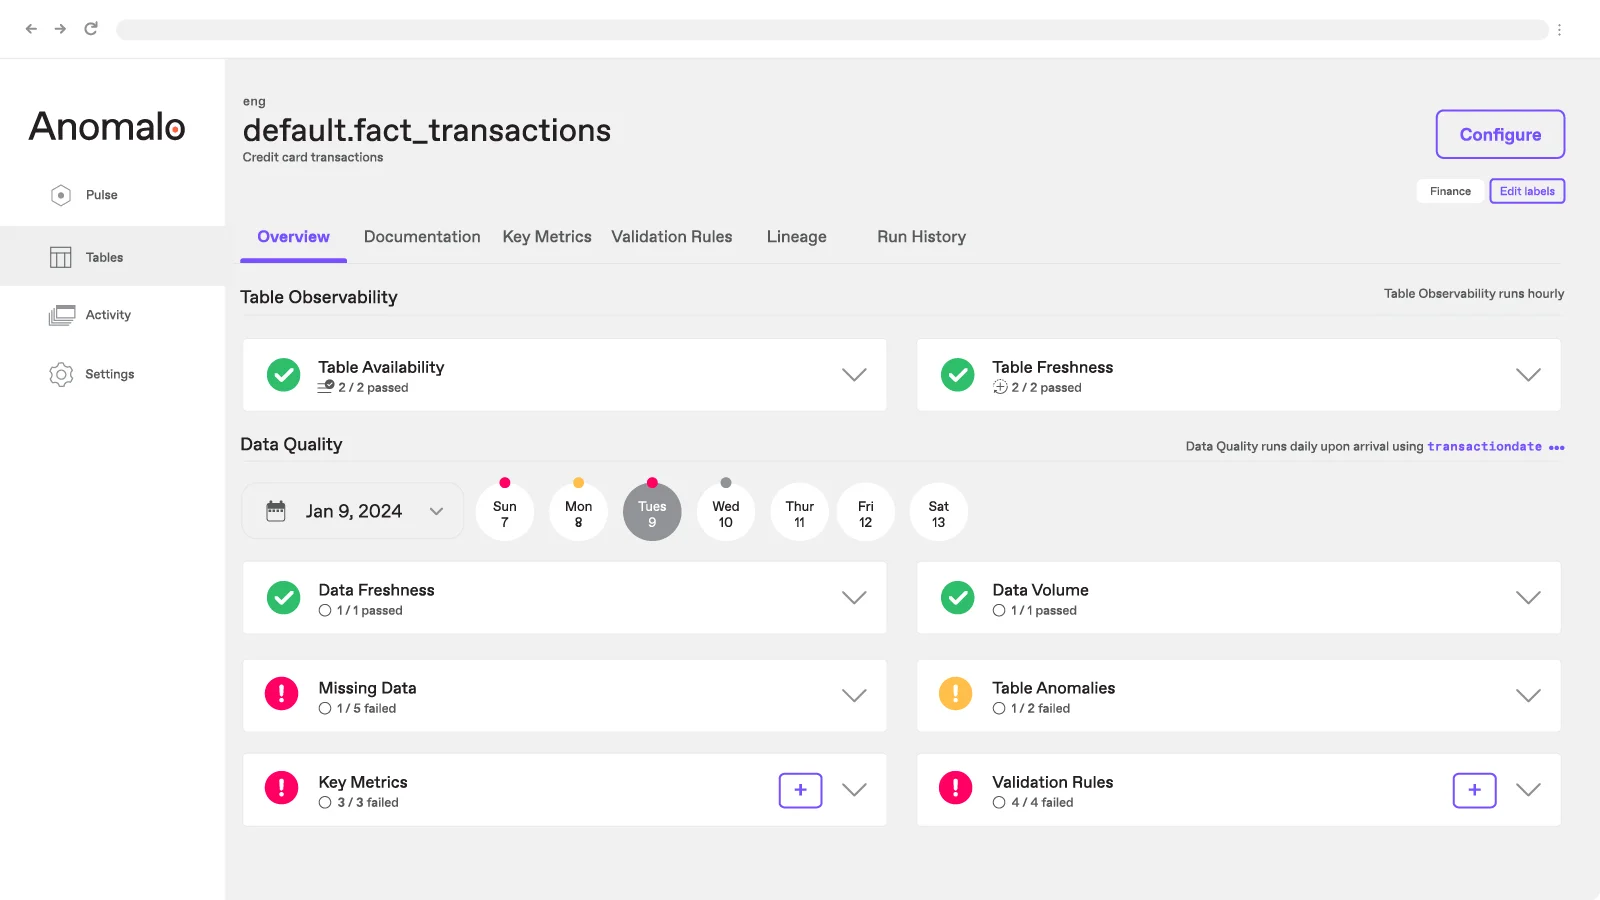
4. Anomalo

Anomalo is a platform for data observability, aimed at improving insights into data health across pipelines and warehouses. By integrating AI-driven anomaly detection and validation rules, it enables teams to pinpoint data quality issues, optimize operational workflows, and ensure consistent data trust.
Key features include:
- AI-powered anomaly detection: Automatically identifies data changes, flagging potential anomalies that may indicate quality issues.
- Data quality oversight: Provides monitoring of key data quality metrics, ensuring consistency and completeness across data warehouses.
- Scalable monitoring: Sets up observability checks across tables in a data warehouse.
- Migration assistance: Compares data before and after migrations to confirm consistency in data replication across environments.
- Instant alerts: Notifies teams of data issues as they are detected.

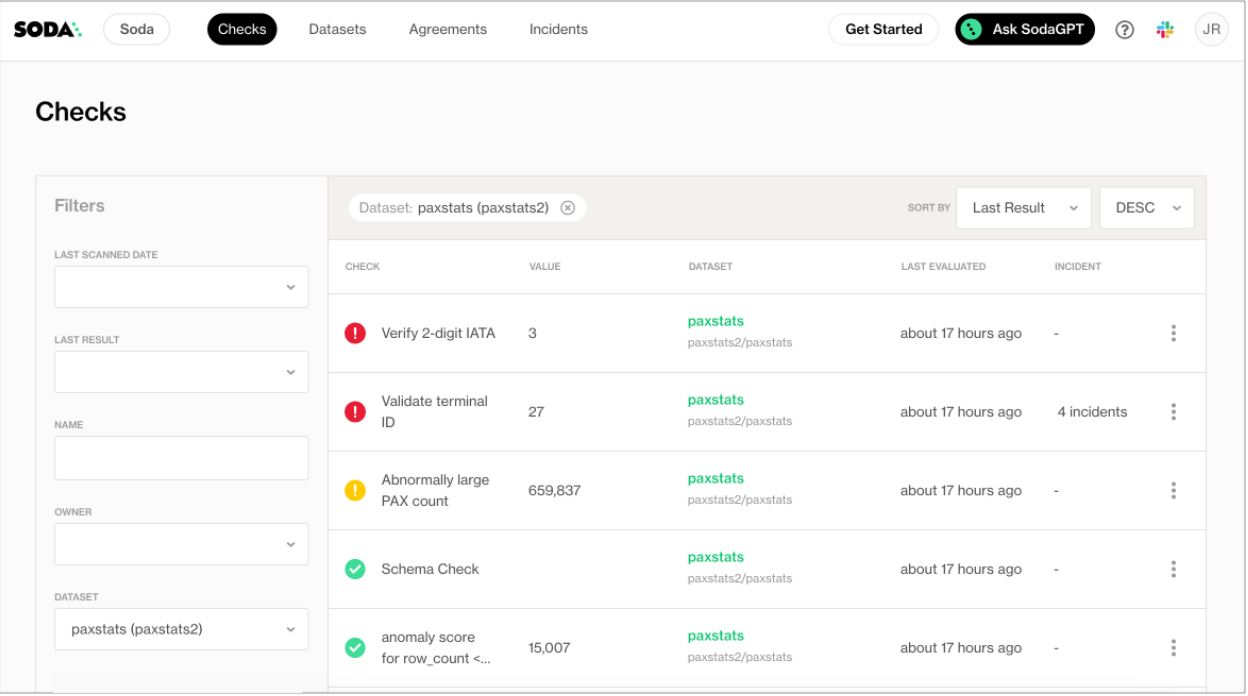
5. Soda

Soda is a data observability platform to improve both detection and prevention of data issues. By merging metrics observability with collaborative data contracts, it allows teams to detect anomalies and address data quality issues.
Key features include:
- Metrics observability: Detects anomalies faster than traditional methods, providing alerts with context.
- Pipeline testing: Ensures high-quality data by testing early in the pipeline and CI/CD workflows.
- Collaborative data contracts: Converts detected issues into contracts between producers and consumers, preventing future disruptions.
- Operational data quality: Routes alerts to the appropriate data owners for quick resolutions.
- AI detection engine: Soda’s engine offers control and adaptability to evolving data patterns.
Considerations for Choosing Data Observability Tools
Selecting a data observability tool requires more than just feature comparison. Organizations must evaluate how well a tool aligns with their existing data infrastructure, team workflows, and operational goals. Here are some key and often overlooked considerations that help determine the right fit:
Integration with existing stack: The tool should natively support current data warehouses, ETL tools, orchestration platforms, and cloud environments. Poor integration can lead to blind spots or manual instrumentation overhead.
Scalability and performance overhead: Ensure the tool can scale with data volumes and pipeline complexity without introducing latency or resource contention. Lightweight metadata collection is preferred over invasive methods.
Customization and rule flexibility: Some platforms offer rigid, prebuilt monitors. Look for tools that allow custom rules, thresholds, and logic tailored to specific business or data domain needs.
Support for diverse data workloads: Not all observability tools handle batch, streaming, and real-time workloads equally well. If the team relies on mixed-mode pipelines, validate comprehensive support across data types and processing modes.
Governance and access control: Data observability platforms should align with company data governance policies, offering role-based access, audit logging, and sensitive data masking as needed.
Incident response and collaboration features: Consider how the tool fits into the team's incident response process. Integrated ticketing, ownership assignment, and communication features are essential for high-functioning data operations.
Vendor lock-in and openness: Tools based on open standards (e.g., OpenTelemetry) offer better flexibility and avoid lock-in. Evaluate the ease of extracting data, exporting metadata, and switching vendors.
Pricing model transparency: Some tools charge based on monitored assets, data volume, or alert frequency. Understand how pricing scales with usage to avoid unexpected cost spikes.
Support and community maturity: Reliable vendor support, clear documentation, and a strong user community can significantly ease adoption and troubleshooting during deployment and scaling.
Conclusion
Data observability tools play a critical role in maintaining trust and reliability in modern data systems. By providing real-time visibility into data pipelines, quality, and performance, they help organizations detect issues early, prevent downstream impacts, and ensure that data-driven decisions are based on accurate information.
Fashion Retailer Mango’s Data Journey with Collate
Read the case study

Sign up to receive updates for Collate services, events, and products.
Share this article


Ready for trusted intelligence?
See how Collate helps teams work smarter with trusted data